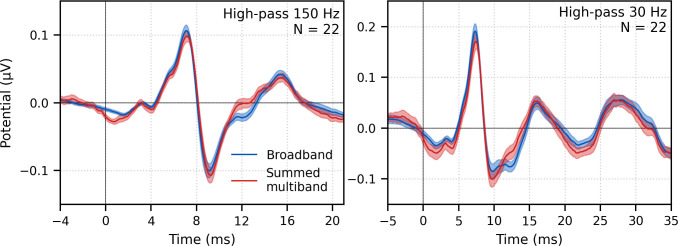
Figure 7. Comparison of responses to ~43 min of male-narrated peaky speech in the same subjects.
Average waveforms across subjects (areas show ±1 SEM) are shown for broadband peaky speech (blue) and summed frequency-specific responses to multiband peaky speech with the common component added (red), high-pass filtered at 150 Hz (left) and 30 Hz (right). Regressors in the deconvolution were pulse trains.

