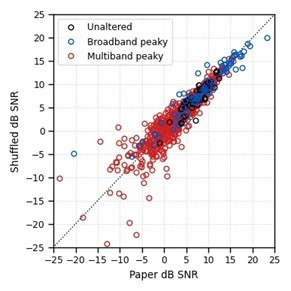
Author response image 1. SNR (dB) calculations based on the response pre-stimulus baseline as used in the paper versus based off the pre-stimulus baseline and stimulus response window of the responses calculated to the wrong stimulus.

The same EEG was used for each calculation. SNRs groups around the unity line, except for similar numbers of responses that were better/worse than the paper’s SNR calculator for those responses that have poor SNR (<-5 dB SNR).
