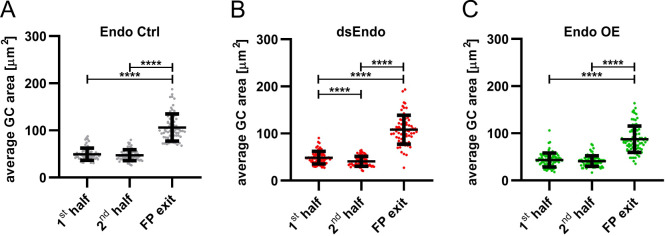
Figure 11. Growth cone size is enlarged at the floor-plate exit site.
Data at the single axon level extracted from 24 hr time-lapse recordings of dI1 axons crossing the floor plate. The average growth cone area was measured in the first half, the second half and at the exit site of the floor plate for each condition. (A) No difference in the area was detected between growth cones in the first half and the second half of the floor plate in controls. However, growth cones were found to be much enlarged at the exit site compared to when they were in the floor plate (Friedman test with Dunn’s multiple-comparisons test). (B) Unilateral down regulation of Endoglycan induced a significant decrease in the average growth cone area in the second part of the floor plate compared to the first part. However, dI1 growth cones still got much larger when exiting the floor plate compared to when they were located in the floor plate (one-way ANOVA with Sidak’s multiple-comparisons test). (C) After unilateral overexpression of Endoglycan, no difference in growth cone area was detected between the first and the second half of the floor plate. Like in all other conditions, they were found to be much enlarged at the exit site (Friedman test with Dunn’s multiple-comparisons test). Error bars represent standard deviation. p<0.0001 (****) for all tests. N(embryos)=3 for each condition; n(axons)=70 (Endo Ctrl), 78 (ds Endo), 83 (Endo OE). See Table 2 for detailed results. Source data and statistics are available in Figure 11—source data 1 spreadsheet.

