. 2021 Mar 2;10:e64767. doi: 10.7554/eLife.64767

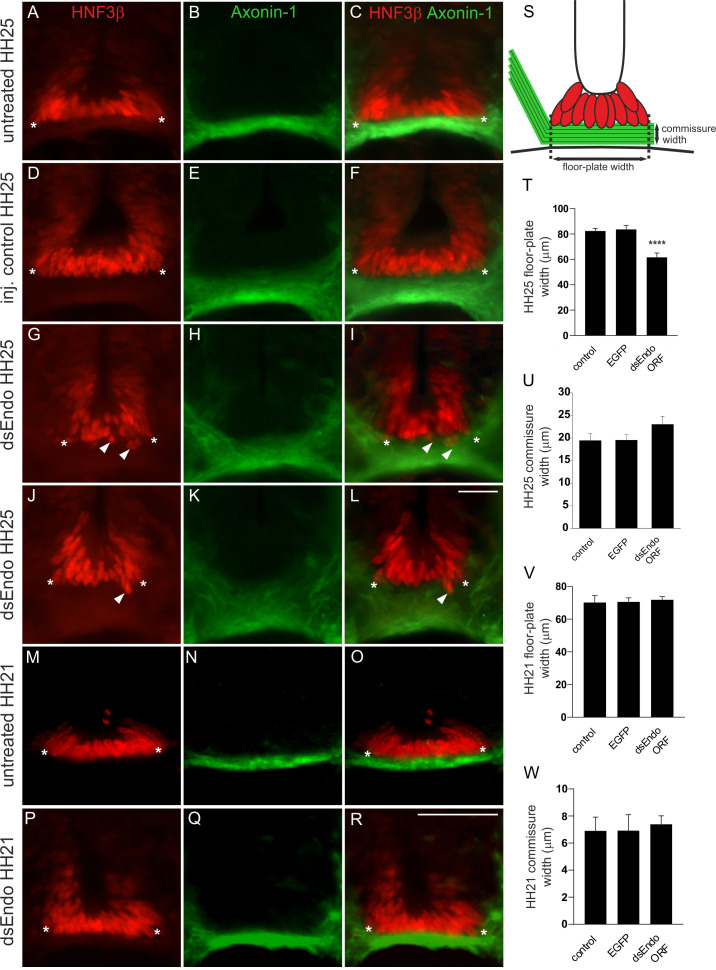
Figure 3. After downregulation of Endoglycan in one half of the spinal cord, the floor-plate morphology is compromised only after axonal midline crossing.

In untreated (A-C) and control-treated embryos (D-F), the floor plate is of triangular shape with floor-plate cells precisely aligned at the ventral border. There is no overlap between the floor plate (visualized by HNF3β staining; red) and the commissure (visualized by anti-Axonin1 staining; green). The shape of the floor plate is no longer triangular in embryos lacking Endoglycan (G-L). The floor-plate cells are not aligned ventrally (arrowheads in G, I, J, and L) and the floor plate appears to have gaps. This change in morphology is only seen at HH25, when midline crossing is completed. When the floor-plate morphology was analyzed at HH21, there was no difference between control (M-O) and experimental embryos electroporated with dsRNA derived from Endoglycan (P-R). Note that some more ventral commissural axon populations have crossed the floor plate at this stage. But overall, the number of axons that form the commissure at HH21 is still very small. The width of the floor plate (indicated by asterisks) was measured (S,T). There was no significant difference in spinal cord width at HH25 (400.2 ± 54.5 µm in untreated controls, 438.2 ± 30.3 µm in EGFP-expressing controls, and 394 ± 12.0 µm in dsEndo embryos), but floor plates were significantly narrower in embryos lacking Endoglycan (T; 61.6 ± 2.9 µm; n = 7 embryos; p<0.001) compared to untreated (82.4 ± 1.8 µm; n = 6 embryos) and EGFP-injected control embryos (83.6 ± 2.6 µm; n = 6 embryos). One-way ANOVA with Tukey’s multiple comparisons test. The commissure had a tendency to be wider in experimental compared to control embryos but the effect was not statistically significant (U). The width of the floor plate was not different between groups when measured at HH21 (V) with 70.1 ± 4.2 µm (n = 3) for untreated and 70.6 ± 2.5 µm for EGFP controls (n = 4), compared to 71.8 ± 2.0 µm for experimental embryos (n = 3). No difference was seen in the width of the commissure. Two-tailed T-test. ****p<0.0001. Mean ± SEM are given. Electroporation was targeted to one side of the spinal cord as shown in the insert in Figure 2H. Bar: 50 µm. Source data and statistics are available in Figure 3—source data 1 spreadsheet.

Figure 3—source data 1. Raw data and statistics for Figure 3.

Figure 3.

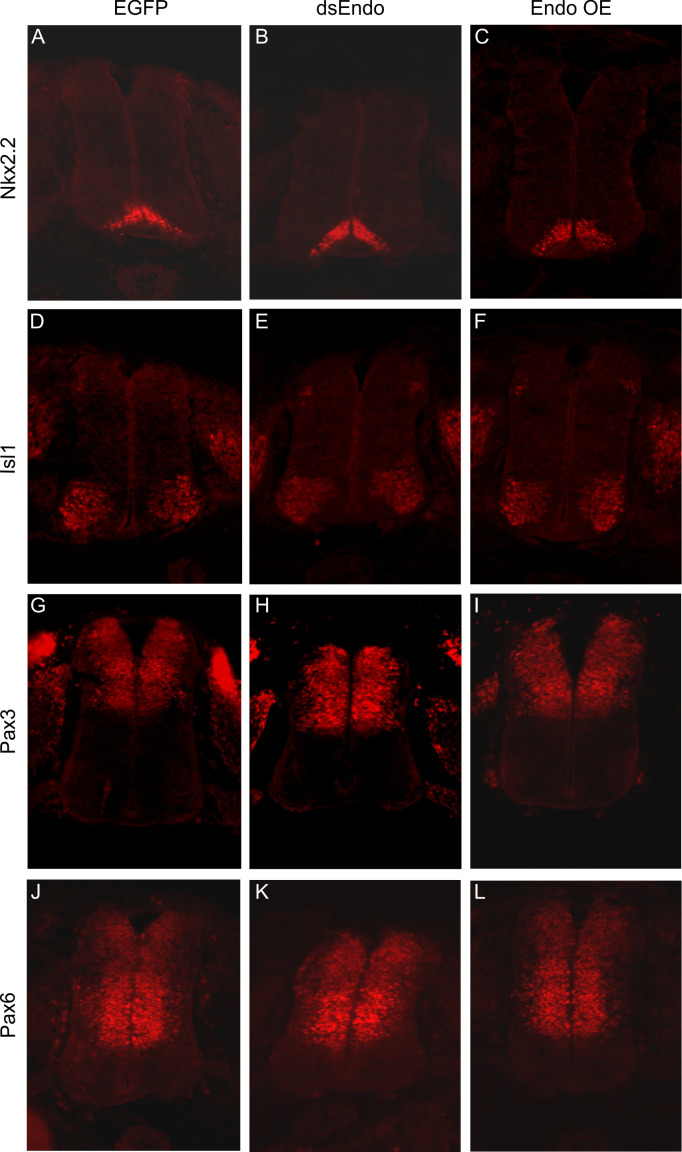
Figure 3—figure supplement 1. Downregulation or overexpression of Endoglycan does not affect spinal cord patterning.

Figure 3—figure supplement 1.

To check whether the effect of Endoglycan perturbation on axonal pathfinding was indirect due to changes in spinal cord patterning, we used a series of antibodies to stain sections taken from control embryos expressing GFP (A,D,G,J), embryos electroporated with dsEndo (B,E,H,K), or embryos overexpressing Endoglycan (C,F,I,L). We found no evidence for aberrant patterning, when we compared sections stained with Nkx2.2 (A–C), Islet1 (D–F), Pax3 (G–I), or Pax6 (J–L).
Figure 3—figure supplement 2. Experimental manipulation of Endoglycan levels does not induce cell death in the floor plate.
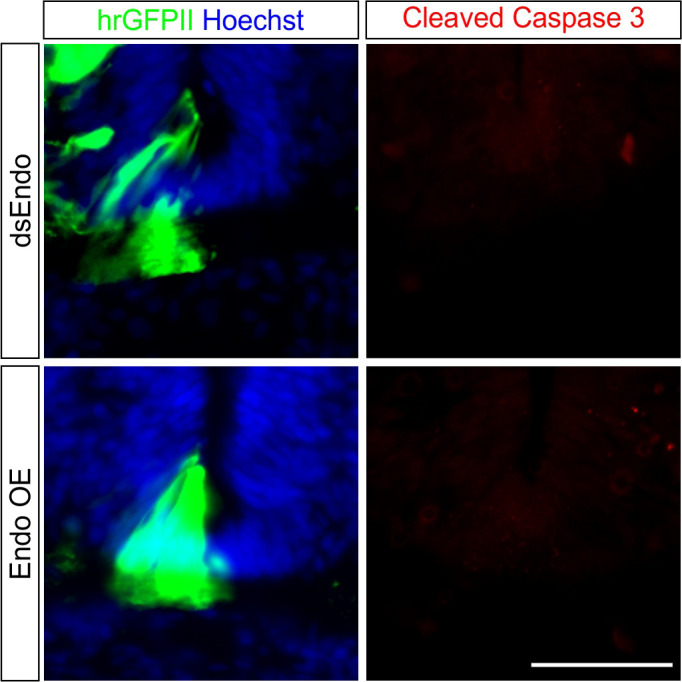
Figure 3—figure supplement 2.

To exclude that changes in floor plate morphology were caused by apoptosis as a consequence of lowering levels of Endoglycan by the electroporation of dsEndo (upper row) or increasing levels of Endoglycan by expressing a plasmid encoding chicken Endoglycan (lower row), we stained sections taken from HH25 embryos with antibodies against cleaved caspase-3. We did not see any staining in either of the experimental groups nor in untreated control embryos (not shown). Therefore, apoptosis can be ruled out as an explanation for the changes in floor-plate morphology. Bar: 50 µm.
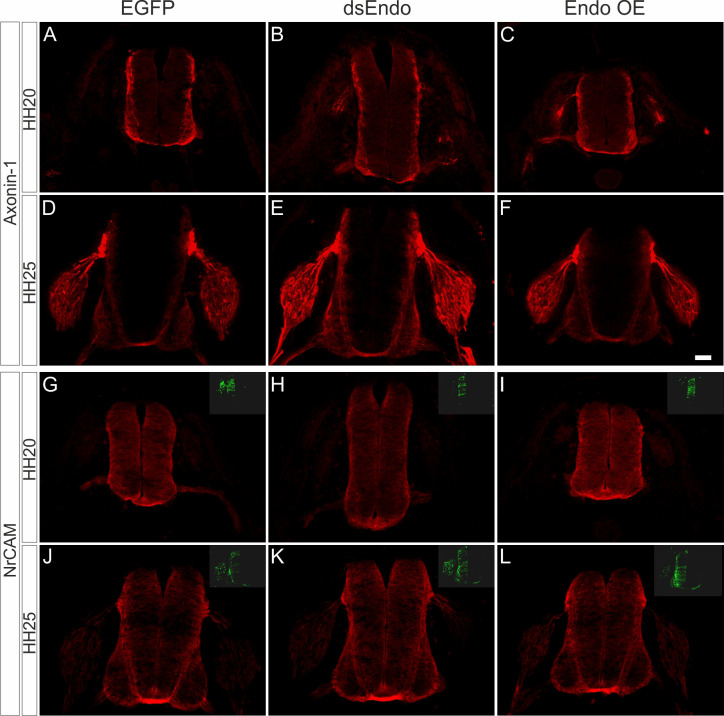
Figure 3—figure supplement 3. The errors in commissural axon pathfinding seen after perturbation of Endoglycan levels are not due to changes in the expression of known guidance cues for dI1 axons.

Figure 3—figure supplement 3.

To exclude that the changes in axonal pathfinding seen after silencing or overexpression of Endoglycan were explained by an effect on the expression of known axon guidance cues for dI1 axons, Axonin-1/Contactin-2 (A–F) or NrCAM (G–L), we compared sections taken from control embryos electroporated with a plasmid encoding EGFP (A,D,G,J), embryos electroporated with dsEndo (B,E,H,K), or embryos overexpressing Endoglycan (C,F,I,L). We found no differences in expression of Axonin-1 and NrCAM. We compared sections taken from embryos sacrificed at HH20 (A–C, G–I) and HH25 (D–F, J–L). Bar: 50 µm.
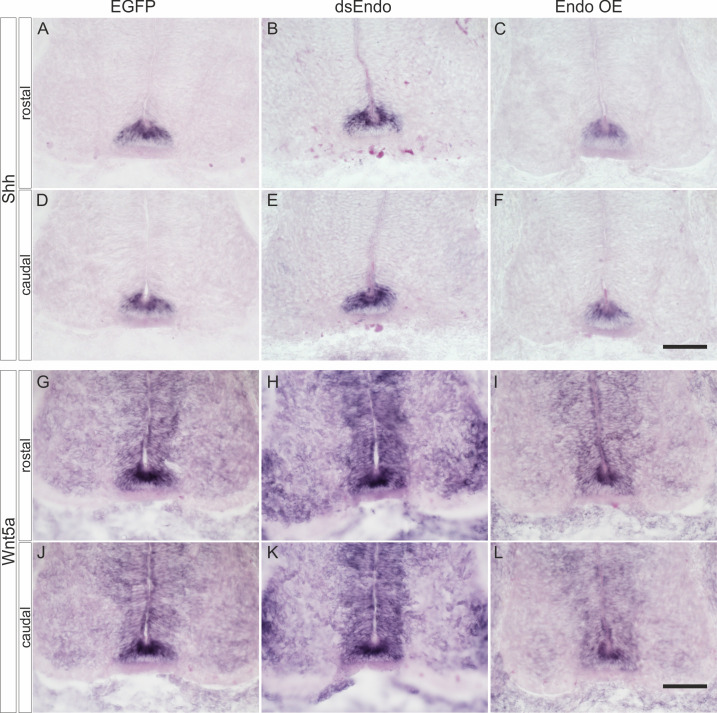
Figure 3—figure supplement 4. Perturbation of Endoglycan expression does not affect guidance of post-crossing commissural axons indirectly by changing Shh or Wnt5a expression.

Figure 3—figure supplement 4.

We did not find any changes in the expression of Shh (A–F) or Wnt5a (G–L) compared to control embryos expressing EGFP (A,D,G,J) after silencing Endoglycan (B,E,H,K) or after overexpression of Endoglycan (C,F,I,L). Shh was found at higher levels in the caudal compared to the rostral floor plate (A–F), as reported previously (Bourikas et al., 2005). Wnt5a levels did not differ between rostral and caudal sections taken from the lumbar part of the spinal cord, as reported earlier (Domanitskaya et al., 2010).