. 2021 Mar 10;10:e65202. doi: 10.7554/eLife.65202

Figure 2. Efficient KI of SEP-GluA1-3 and GFP-gephyrin using TKIT.

(A) SEP-GluA1, (B) SEP-GluA2, (C) SEP-GluA3, and (D) GFP-gephyrin visualized with confocal microscopy after neurons were co-transfected with TKIT constructs and a mCherry cell fill. Segments of dendrite in the white boxed region are enlarged below. Scale bar, 20 μm or 5 μm. Average efficiency of KI for (E) SEP-GluA1, (F) SEP-GluA2, (G) SEP-GluA3, and (H) GFP-gephyrin. Error bars display SEM.

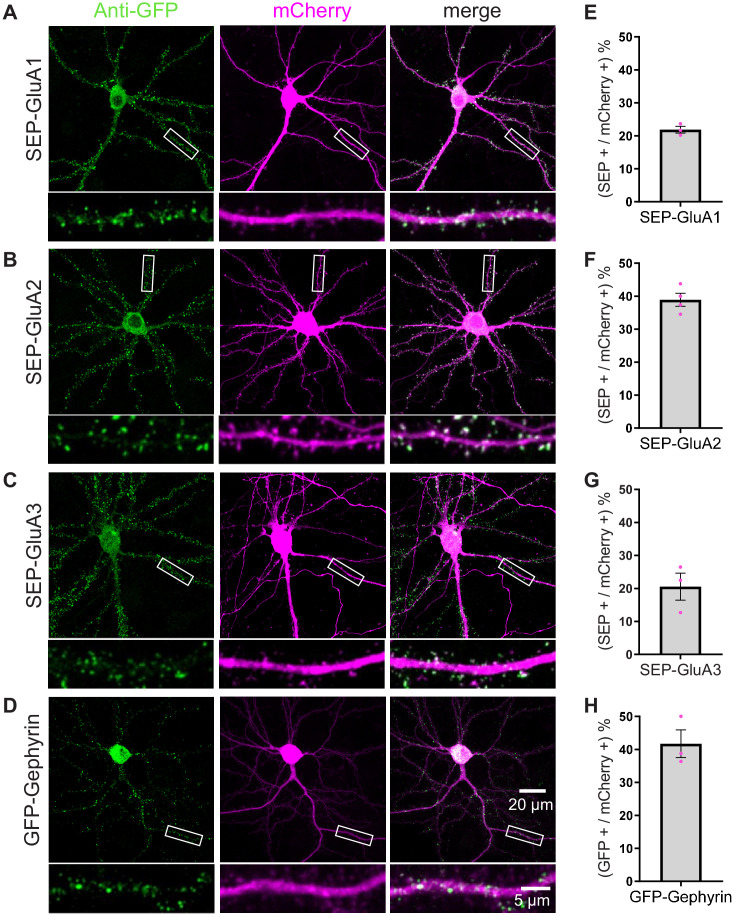
Figure 2—source data 1. Efficiency counts to assess TKIT knockin of SEP-GluA1, SEP-GluA2, SEP-GluA3, and GFP-Gephyrin in mouse neurons.

Figure 2.

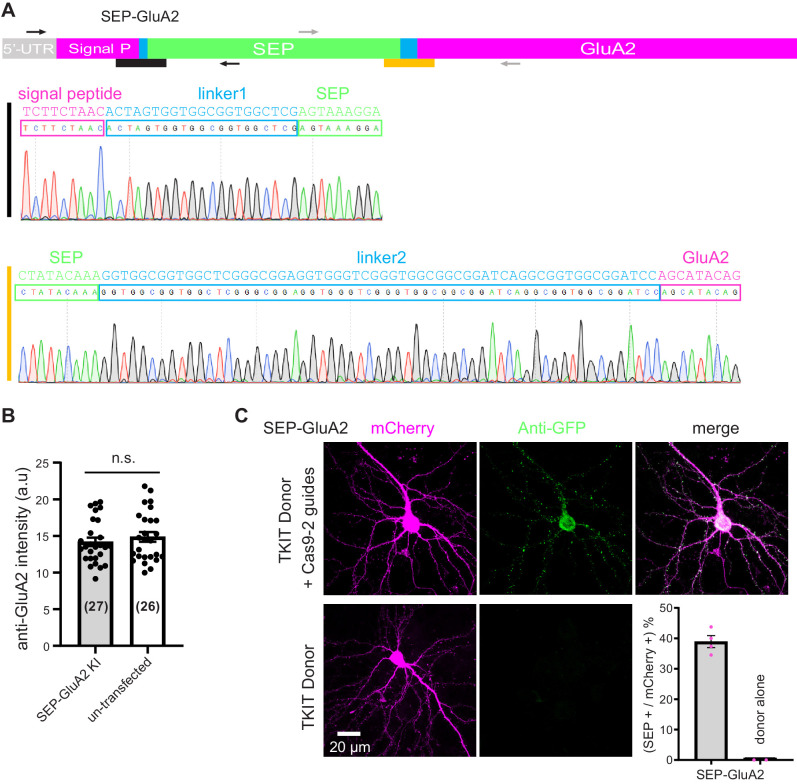
Figure 2—figure supplement 1. Correct splicing of SEP-GluA2 and comparable GluA2 levels in KI and WT surrounding neurons.

Figure 2—figure supplement 1.

(A) Sequence analysis of cDNA reverse-transcribed from mRNA extracted from neuronal cultures electroporated with TKIT SEP-GluA2 constructs. The black line indicates the junction between the signal peptide and linker1-SEP and the orange line indicates the junction between SEP-linker2 and the mature protein. The magenta region indicates the endogenous protein sequence, the green sequence indicates SEP and the blue sequence indicates linkers. Black and gray arrows indicate the location of PCR primer pairs. (B) Quantification of synaptic GluA2 levels with immunofluorescence. GluA2 levels in SEP-GluA2 KI neurons are comparable with non-transfected (WT) neurons (data from 27 SEP-GluA2 KI neurons and 26 surrounding non-transfected neurons). Data presented as mean ± SEM. Individual data points are shown as black dots. Unpaired Student’s t-test for comparison (p=0.4495). (C) Transfection of TKIT donor alone does not produce KI. Representative images showing TKIT of SEP-GluA2 KI compared to TKIT donor-only control. Average efficiency of KI for SEP-GluA2 compared to donor-only control (bottom right corner). Scale bar indicates 20 μm.
Figure 2—figure supplement 1—source data 1. GluA2 expression levels in SEP-GluA2 knockin and untransfected neurons.
Figure 2—figure supplement 1—source data 2. SEP-GluA2 knockin efficiency compared to donor-only control.
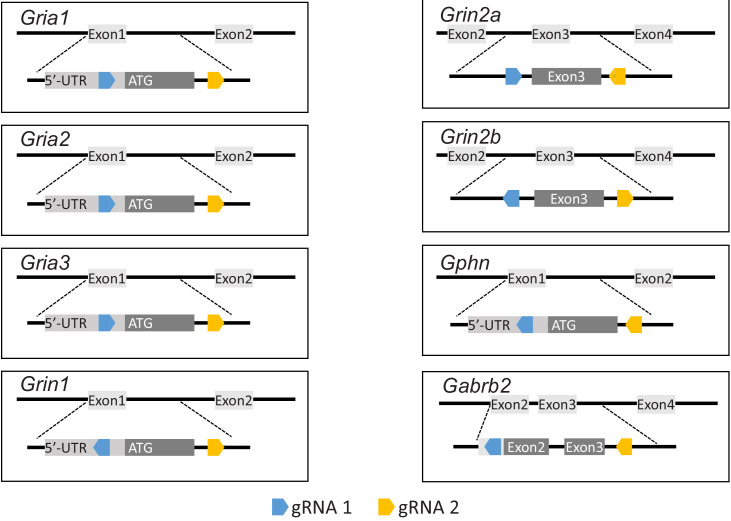
Figure 2—figure supplement 2. Location of TKIT guide pairs.

Figure 2—figure supplement 2.

Schematic illustrating the location of all guide RNAs and their orientation in all genes targeted for TKIT. In each panel the top portion indicates the partial exons and introns being targeted. The bottom part shows an enlargement of the region to be edited. The light gray rectangle indicates the 5’-UTR. The dark gray rectangle indicates the coding sequence. The blue and orange pentagons indicate guide RNA (gRNA) 1 and 2, respectively. The genes Gria1, Gria2, Gria3, Grin1, Grin2a, Grin2b, Gepn, and Gabrb2 encode for GluA1, GluA2, GluA3, NR1, NR2A, NR2B, Gephyrin, and GABAAR Beta-2, respectively.
Figure 2—figure supplement 3. TKIT of SEP-GABAAR β2.

Figure 2—figure supplement 3.

(A) Representative immunofluorescent images demonstrating TKIT of SEP-GABAAR β2 (SEP- β2). The dendritic region within the white box is enlarged below to better illustrate co-localization between SEP-β2 (green) and anti-β2 signal (magenta). Note: the cell-fill channel was removed from the enlarged overlay images for clarity. Scale bars display 20 μm or 5 μm. (B) Average efficiency of SEP-β2 KI was 27.22 ± 3.24%. Data presented as mean ± SEM.
Figure 2—figure supplement 3—source data 1. Efficiency counts to assess TKIT knockin of SEP-GABAAR β2 in mouse neurons.
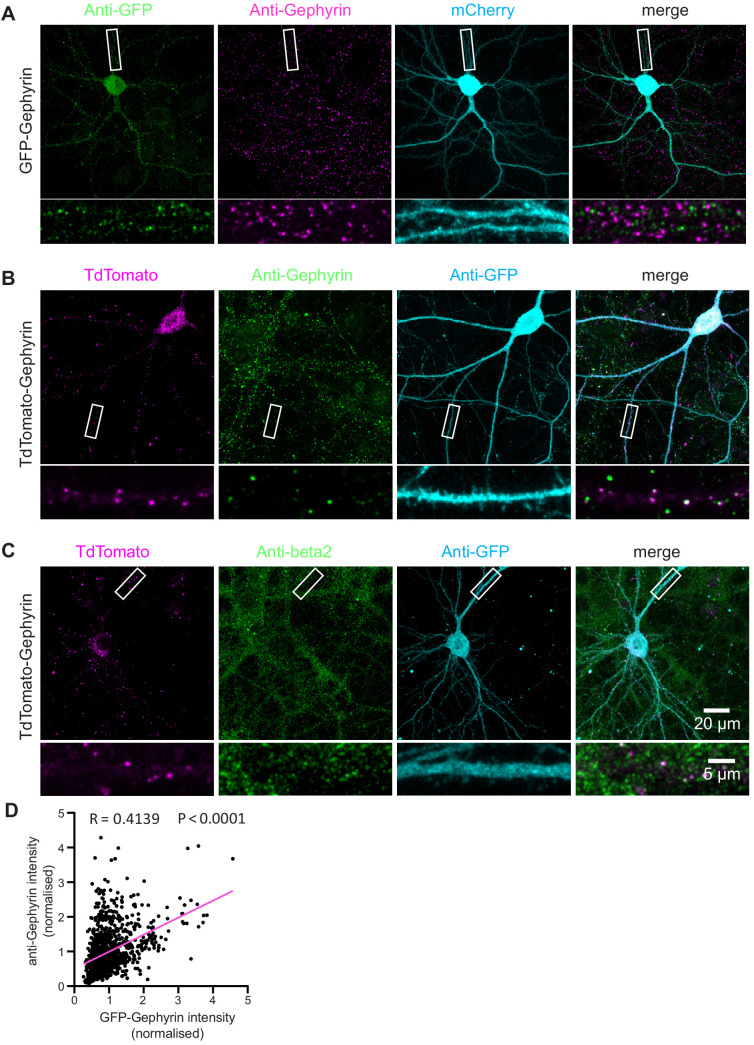
Figure 2—figure supplement 4. TKIT of GFP-Gephyrin and tdTomato-Gephyrin.

Figure 2—figure supplement 4.

(A) Representative immunofluorescent images demonstrating TKIT of GFP-Gephyrin. The dendritic region within the white box is enlarged below to better illustrate co-localization between GFP-Gephyrin (green) and anti-Gephyrin signal (magenta). (B) Representative immunofluorescent images demonstrating TKIT of tdTomato-Gephyrin. The dendritic region within the white box is enlarged below to better illustrate co-localization between tdTomato-Gephyrin (magenta) and anti-Gephyrin signal (green). (C) Representative immunofluorescent images demonstrating TKIT of tdTomato-Gephyrin. The dendritic region within the white box is enlarged below to better illustrate co-localization between tdTomato-Gephyrin (magenta) and the β2 GABAA receptor subunit (green). Note: the cell-fill channel was removed from the enlarged overlay images for clarity. Scale bars display 20 μm or 5 μm. (D) Scatter plot showing the correlation between GFP-Gephyrin (from KI) and anti-Gephyrin staining intensity (from immunofluorescence). Correlation (slope) between GFP and anti-Gephyrin fluorescent intensity was calculated by Simple Linear Regression (GraphPad Prism 7 or 8). Data from 20 neurons and 1007 GFP-Gephyrin puncta.
Figure 2—figure supplement 4—source data 1. Immunofluorescence data for correlation of GFP-Gephyrin knockin signal with gephyrin.
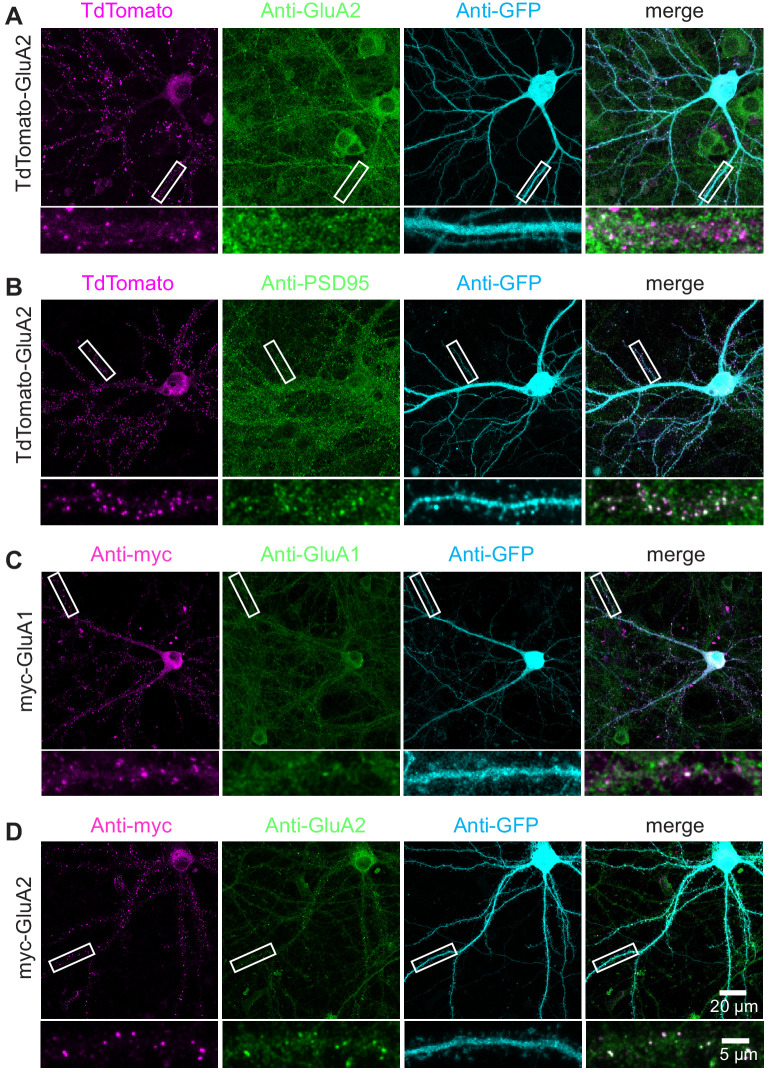
Figure 2—figure supplement 5. TKIT of alternative tags for AMPA receptors.

Figure 2—figure supplement 5.

(A and B) Representative immunofluorescent images demonstrating TKIT of tdTomato-GluA2. The dendritic region within the white box is enlarged below to better illustrate co-localization between tdTomato-GluA2 (magenta) and GluA2 (green, A) or PSD95 (green, B). (C and D) Representative immunofluorescent images demonstrating TKIT of myc-GluA1 and myc-GluA2. The dendritic region within the white box is enlarged below to better illustrate co-localization between myc-GluA1 and myc-GluA2 (magenta) with GluA1 and GluA2 (green), respectively. Note: The cell-fill channel was removed from the enlarged merged images for clarity. Scale bars display 20 μm or 5 μm.
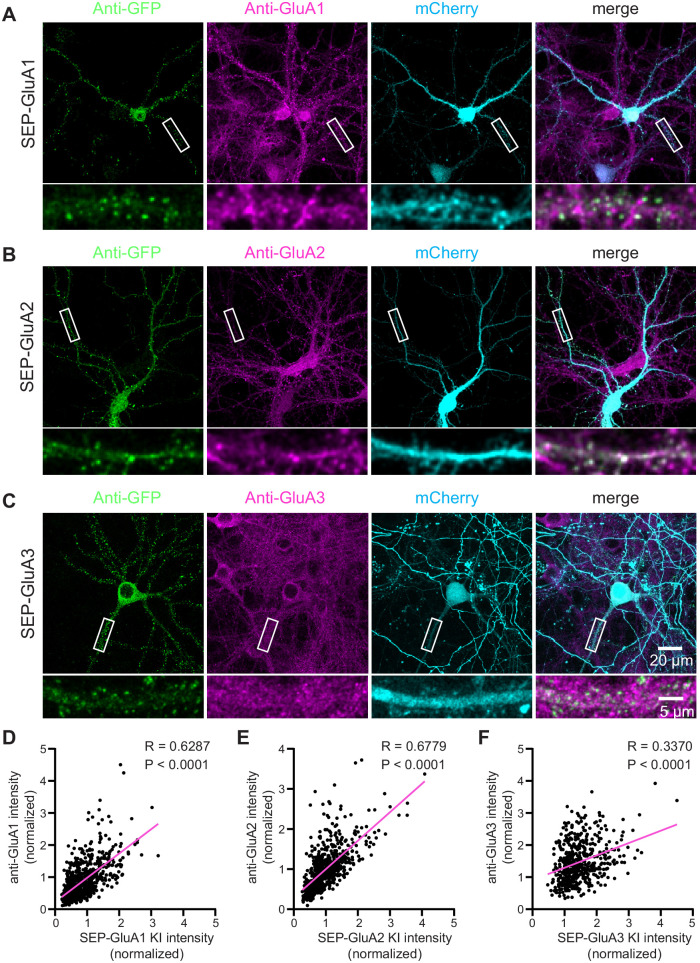
Figure 2—figure supplement 6. Correlation of SEP-GluA1-3 KI with endogenous AMPA receptors.

Figure 2—figure supplement 6.

(A–C) Representative immunofluorescent images showing TKIT of SEP-GluA1 (A), SEP-GluA2 (B), and SEP-GluA3 (C). The dendritic region within the white box is enlarged below to better illustrate co-localization between SEP-GluA1 (green) and GluA1 (magenta, A), SEP-GluA2 (green) and GluA2 (magenta, B), and SEP-GluA3 (green) and GluA3 (magenta, C). Note: The cell-fill channel was removed from the enlarged overlay images for clarity. Scale bars display 20 μm or 5 μm. (D–F) Scatter plots showing the correlation between SEP-GluA1-3 and anti-GluA1-3 immunofluorescence intensity. Correlation (slope) between SEP and anti-GluAs fluorescent intensity was calculated by Simple Linear Regression (GraphPad Prism 7 or 8). Data from 14 neurons and 733 synapses for SEP-GluA1, 13 neurons and 668 synapses for SEP-GluA2, and 10 neurons and 508 synapses for SEP-GluA3.
Figure 2—figure supplement 6—source data 1. Immunofluorescence data for correlation of SEP-GluA1, SEP-GluA2, and SEP-GluA3 knockin signal with GluA1, GluA2, and GluA3, respectively.