. 2021 Mar 10;10:e65202. doi: 10.7554/eLife.65202

Figure 7. TKIT KI and FRAP in rat neurons.

TKIT-mediated KI of SEP-GluA1 (A) and SEP-GluA2 (B) in primary cultured rat neurons. Efficiency of KI for SEP-GluA1 (C) and SEP-GluA2 (D). (E) Representative example of a SEP-GluA1 containing spine undergoing bleaching and fluorescence recovery. The white arrow indicates the spine that will be bleached. Images are separated by 2 min intervals. Scale bar indicates 5 μm. (F) Summary of SEP-GluA1 FRAP data with estimated recovery time and immobile fraction of receptors. Red trace is from exponential (one-phase decay) fitting, GraphPad Prism 7.

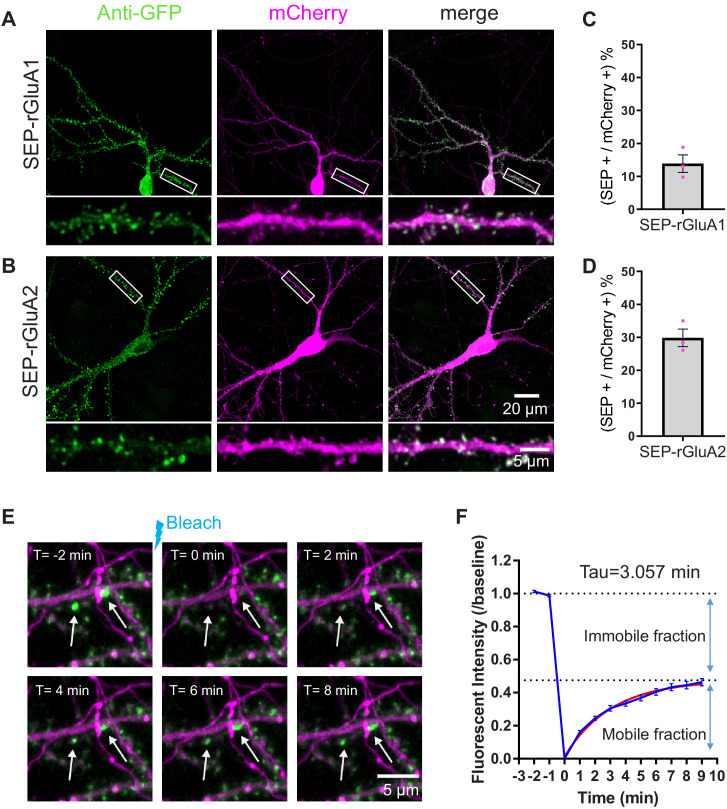
Figure 7—source data 1. Efficiency counts to assess TKIT knockin of SEP-GluA1 and SEP-GluA2 in rat neurons.
Figure 7—source data 2. Fluorescence recovery after photobleaching data to assess SEP-GluA1 mobility in rat neurons.
Source Data for figure supplements.

Figure 7.

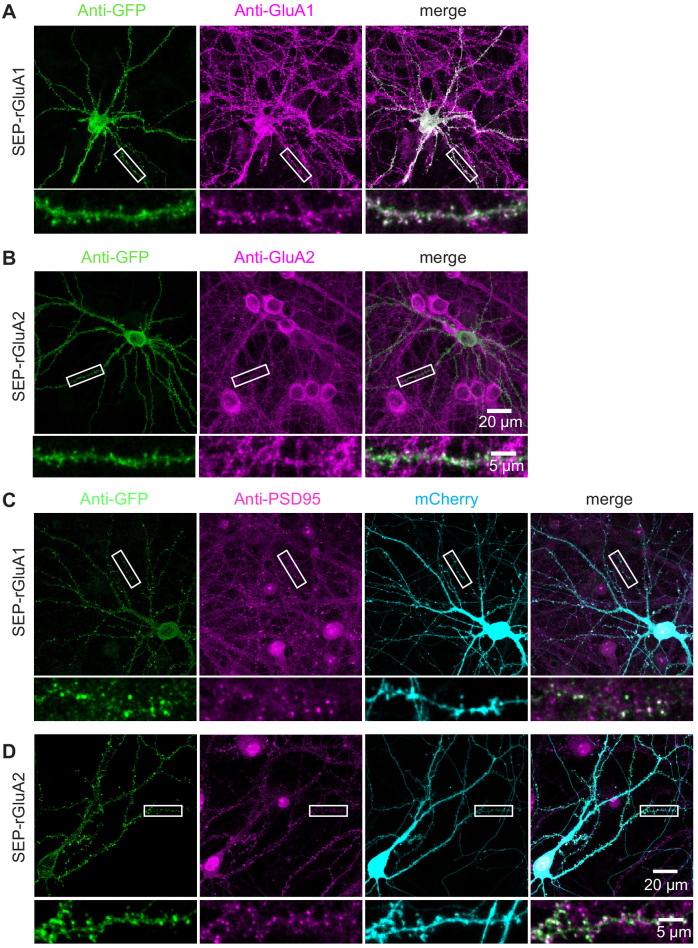
Figure 7—figure supplement 1. TKIT of SEP-GluA1 and SEP-GluA2 KI in rat neurons.

Figure 7—figure supplement 1.

Representative immunofluorescent images demonstrating TKIT of SEP-GluA1 (A) and SEP-GluA2 (B) in rat primary cultured neurons. The dendritic region within the white box is enlarged below to better illustrate co-localization between (A) SEP-GluA1 (green) and GluA1 (magenta), or (B) SEP-GluA2 (green) and GluA2 (magenta). (C and D) Co-localization of SEP-GluA1 and SEP-GluA2 with PSD95. The dendritic region within the white box is enlarged below to better illustrate co-localization between (C) SEP-GluA1 (green) and PSD95 (magenta), or (D) SEP-GluA2 (green) with PSD95 (magenta). Note: The cell-fill channel was removed from the enlarged overlay images for clarity. Scale bars display 20 μm or 5 μm.