. 2021 Mar 9;10:e64351. doi: 10.7554/eLife.64351

Figure 3. Deletion of Dnm1l in AgRP neurons affects fasting-induced mitochondrial fission and mitochondrial respiration.

(a and b) Representative electron micrographs showing mitochondria (asterisks) in an AgRP neuron of the 5-month-old fed Drp1 cKO (a) and the fasted Drp1 cKO male mice (b). Scale bar represents 500 nm. (c–f) Cumulative probability distribution of cross-sectional mitochondria area and average mitochondrial area (c), mitochondrial density (d), aspect ratio and a cumulative probability distribution of mitochondrial aspect ratio (e), and mitochondrial coverage (f) in AgRP neurons from fed Drp1 cKO (n = 720 mitochondria/32 AgRP neurons/4 mice) and fasted Drp1 cKO male mice (n = 746 mitochondria/35 AgRP neurons/4 mice). Data are presented as mean ± SEM. Two-tailed Student’s t-test was used for statistical significance. ns = not significant. (g and h) Graphs showing OCR (g) and its quantification (h) under 2.5 mM glucose incubation with or without palmitate-BSA (200 µM) and with or without etomoxir (40 µM) in primary hypothalamic neuronal culture of control (Dnm1lfl/fl; AgrpCre:ERT2; tdTomato treated with vehicle) and Drp1 cKO mice (n = 6–8/group). Data are presented as mean ± SEM. Two-way ANOVA with Tukey’s post hoc analysis for multiple comparisons was used for statistical significance. (i and j) Graphs showing OCR (i) and its quantification (j) under low glucose (0.5 mM) incubation with or without palmitate-BSA (200 µM) and with or without etomoxir (40 µM) in primary hypothalamic neuronal culture of control (Dnm1lfl/fl; AgrpCre:ERT2; tdTomato treated with vehicle) and Drp1 cKO mice (n = 6–8/group). Data are presented as mean ± SEM. Two-way ANOVA with Tukey’s post hoc analysis for multiple comparisons was used for statistical significance.

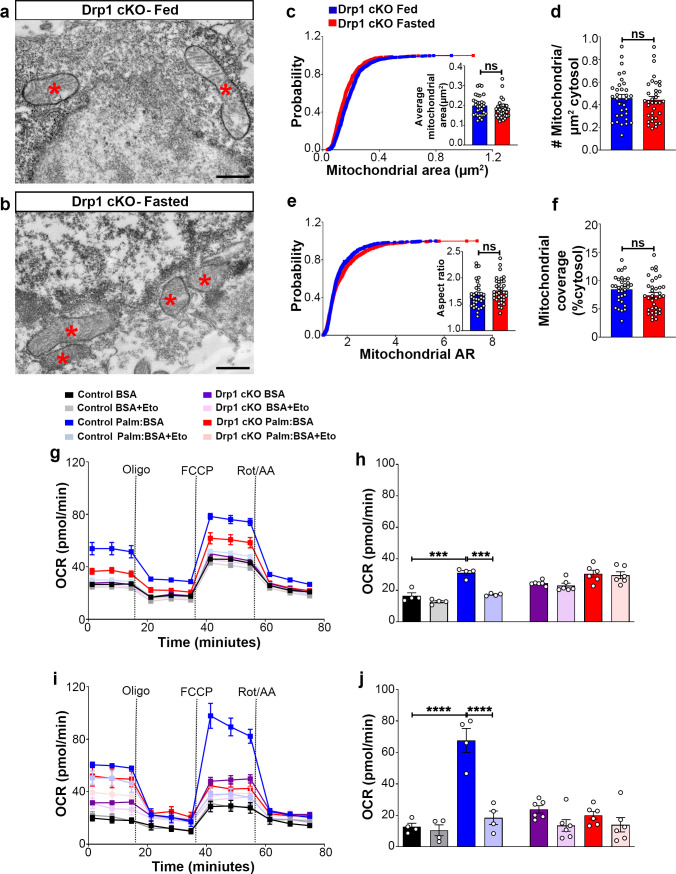
Figure 3—source data 1. Deletion of Dnm1l in AgRP neurons affects fasting-induced mitochondrial fission and mitochondrial respiration.
elife-64351-fig3-data1.xlsx (134.5KB, xlsx)

Figure 3.

Figure 3—figure supplement 1. Generation of AgRP neurons-specific Dnm1l deleted mice.

Figure 3—figure supplement 1.

(a) Schematic showing Dnm1lfl/fl and AgrpCre:ERT2 constructs and the strategy used to generate AgRP neurons-specific Dnm1l deleted mice. First, we generated AgrpCre:ERT2 mice harboring inducible tdTomato floxed by stop codon and then we crossed them with Dnm1lfl/fl mice. (b–g) Representative micrographs showing immunostaining for phosphorylated DRP1 (at serine 616; pDRP1; green, b and c) and fluorescent reporter gene tdTomato (red, representing AgRP, d and e) and merged (f and g) in the hypothalamic ARC of a fasted control (b, d, and f) and a fasted Drp1 cKO male mouse (c, e, and g). Scale bar represents 100 µm. 3V = third ventricle; ARC = arcuate nucleus; ME = median eminence. (h) Graph showing the percentage of pDRP1 expression in AgRP neurons of fasted control (n = 4 mice) and Drp1 cKO male mice (n = 4 mice). Data are presented as mean ± SEM. ****p<0.0001 by unpaired two-tailed Student’s t-tests. (i) Graph showing no difference in total AgRP cell number between fasted control (n = 4 mice) and Drp1 cKO mice (n = 4 mice). Data are presented as mean ± SEM. p=0.4605 by two-tailed Student’s t-test. ns = not significant.
Figure 3—figure supplement 1—source data 1. Generation of AgRP neuron-specific Dnm1l-deleted mice.
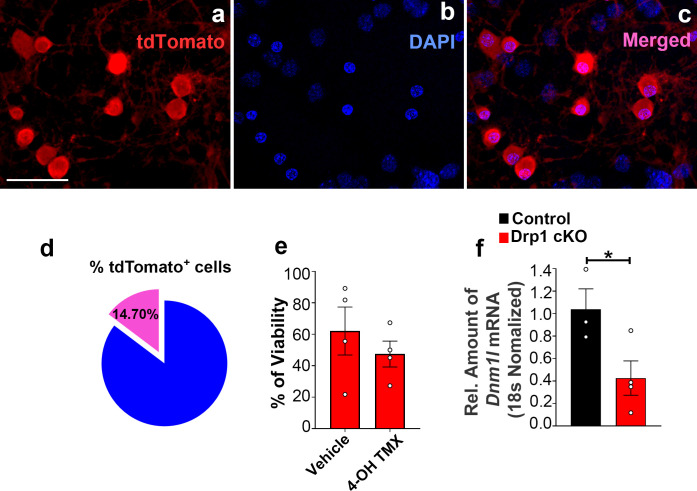
Figure 3—figure supplement 2. Percentage of tdTomato-expressing AgRP neurons and cell viability and Dnm1l deletion induced by 4-hydroxytamoxifen in hypothalamic neuronal cell cultures.

Figure 3—figure supplement 2.

(a–c) Representative micrographs showing fluorescent reporter gene tdTomato (red, representing AgRP neurons, a) and nuclei staining with DAPI (blue, b) and merged (c) in the primary hypothalamic neuronal cultures derived from a Dnm1lfl/fl; AgrpCre:ERT2 mice. Once cultured neurons were treated with 4-hydroxytamoxifen (2 μM) for tdTomato expression. Bar scale in a (for b and c) represents 20 µm. (d) Graph showing quantification of the percentage of tdTomato positive cells among DAPI-stained cells in the primary hypothalamic neuronal cultures (n = 7/group). Please note that no significant difference was observed between the percentage of tdTomato positive cells in this group (from Dnm1lfl/fl;AgrpCre:ERT2 mice) and the tdTomato positive cells derived from Dnm1l+/+; AgrpCre:ERT2 mice shown in Figure 2—figure supplement 1d (p=0.9883 by two-tailed Student’s t-test). (e) Graph showing the percentage quantification of the trypan blue cell viability assay in primary hypothalamic neuronal cells from Drp1 cKO mice (n = 4/group) following either vehicle (ethanol) or 4-hydroxytamoxifen (2 μM) treatment. Data are presented as mean ± SEM. Two-tailed Student’s t-test was used for statistical significance. (f) Real-time PCR data showing relative mRNA levels of Dnm1l in the primary hypothalamic neuronal cell cultures from control (n = 3/group) and Drp1 cKO mice (n = 4/group). Data are presented as mean ± SEM. *p<0.05 by two-tailed Student’s t-test.
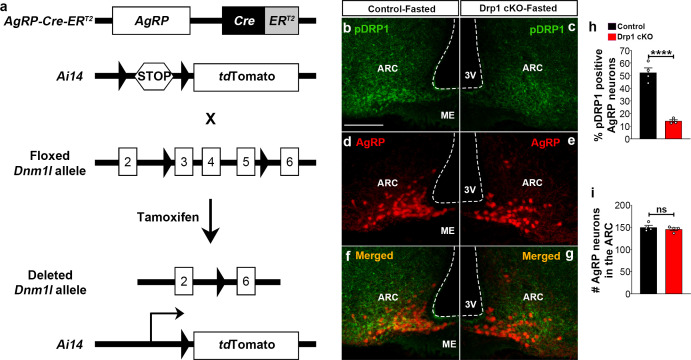
Figure 3—figure supplement 2—source data 1. Source data for Figure 3—figure supplement 2.