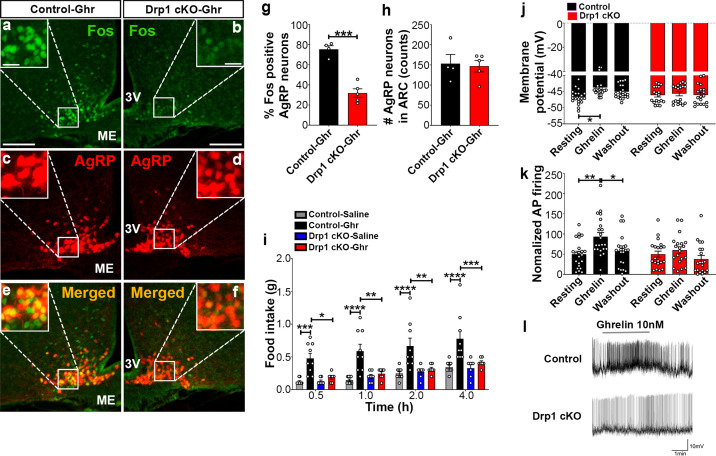
Figure 7. Deletion of Dnm1l in AgRP neurons attenuates ghrelin-induced neuronal activation and feeding.
(a–f) Immunostaining for Fos (green, a and b) and tdTomato (red, representing AgRP, c and d) and merged (e and f) in the ARC of a ghrelin-injected male control (a, c, and e) and a Drp1 cKO mouse (b, d, and f) at 5 months of age. (g) Graph showing the percentage of Fos expression in AgRP neurons of ghrelin-injected control and Drp1 cKO mice (n = 4–5 mice). Data are presented as mean ± SEM. ***p<0.001 by two-tailed Student’s t-test. (h) Graph showing the number of AgRP neurons of ghrelin-injected control and Drp1 cKO mice in the hypothalamic ARC (n = 4–5 mice). Data are presented as mean ± SEM. (i) Food intake in 4-month-old control and Drp1 cKO female mice at 5 months of age (n = 7–9 mice/group) after either saline or ghrelin injection. *p<0.05; **p<0.01; ***p<0.001; ****p<0.0001; Two-way ANOVA with Tukey’s post hoc analysis for multiple comparisons was performed. (j) Graph showing the membrane potential in AgRP neurons of 9–11-week-old control (n = 20 cells/10 mice) and Drp1 cKO male mice (n = 19 cells/10 mice) in response to ghrelin. *p<0.05; Two-way ANOVA with Tukey’s post hoc analysis for multiple comparisons was performed. (k) Graph showing normalized firing rate in AgRP neurons of 9–11-week-old control (n = 20 cells/10 mice) and Drp1 cKO male mice (n = 19 cells/10 mice) in response to ghrelin. Data are presented as mean ± SEM. **p<0.01 for artificial CSF-treated control versus ghrelin-treated control; *p<0.05 for ghrelin-treated control versus washed out control by two-way ANOVA with Tukey’s post hoc analysis for multiple comparisons. (l) Representative tracers of AgRP neurons from a control and a Drp1 cKO mouse in response to ghrelin. Scale bar represents 100 µm. Scale bar in high magnification image represents 20 µm. 3V = third ventricle; ME = median eminence.


