. 2021 Mar 10;10:e64456. doi: 10.7554/eLife.64456

Figure 1. Knockout of TDP-43 in Schwann cells results in a 50% conduction delay without overt alteration of compact myelin.

(A) Longitudinal sections of P28 wild-type (WT) and conditional knockout (cKO) sciatic nerves were immunostained for TDP-43 (green) and Sox10 (magenta). Sox10 labels Schwann cells, which are all TDP-43-negative in the cKO. The cell types other than Schwann cells are Sox10-negative and are still TDP-43-positive in the cKO. Scale bar, 10 μm. (B, C) Motor nerve conduction of P27 mice was measured as compound muscle action potentials at the plantar muscles evoked by stimulation of the nerve at the ankle and sciatic notch. The onset of the compound muscle action potentials is indicated by open arrowheads (ankle stimulation) and solid arrowheads (sciatic notch stimulation) in B. Bars represent mean ± SEM in C. n = 5 mice for WT, 3 for conditional heterozygote (cHet), and 3 for cKO. **p=0.0030 and 0.0028 (WT vs. cKO and cHet vs. cKO, respectively); ns: not significant, p=0.8094 (WT vs. cHet); one-way analysis of variance (ANOVA) with Tukey’s test. (D) Sciatic nerves from P7 WT and cKO mice. (E) The number of myelinated axons per 1000 μm² was quantified with electron micrographs of sciatic nerve cross sections. Bars represent mean ± SEM. n = 3 mice per genotype. *p=0.039 and 0.048 (WT vs. cKO and cHet vs. cKO at P3, respectively); ns: not significant (WT vs. cHet at P3, p=0.9812; P21, p=0.5381); one-way ANOVA with Tukey’s test. (F) Electron micrographs of P3 and P21 sciatic nerve cross sections. Scale bars, 2 μm for P3 and 5 μm for P21. cHet and cKO by Dhh-Cre (A–F).

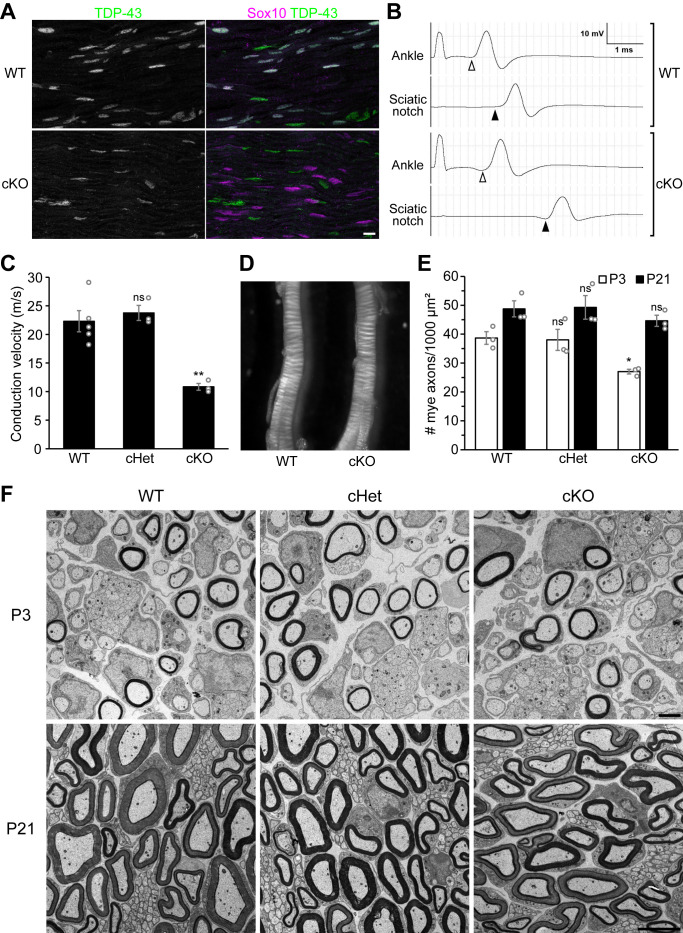
Figure 1—source data 1. Statistical summary for Figure 1C, E and Figure 1—figure supplement 2.

Figure 1.

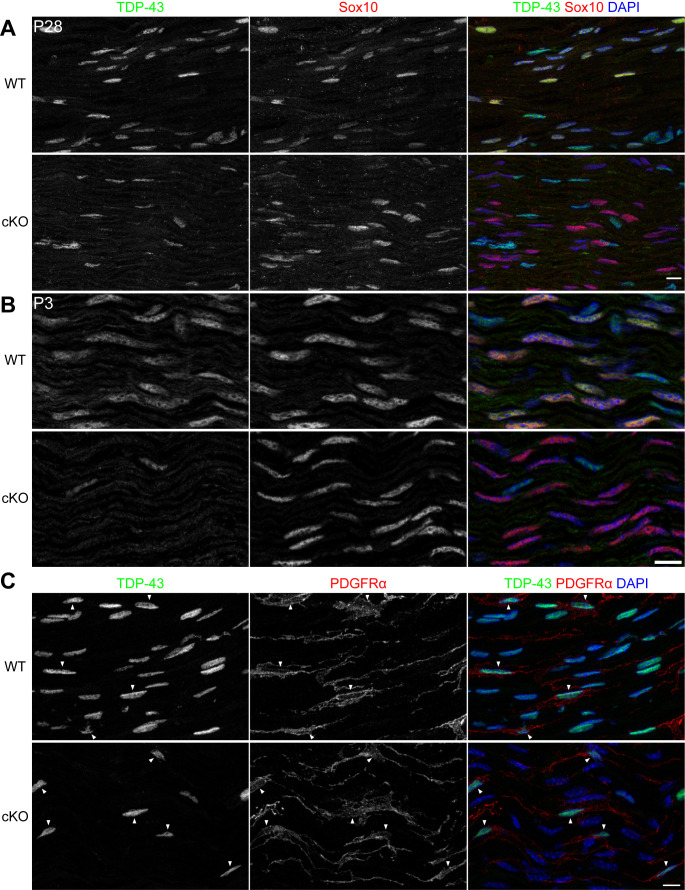
Figure 1—figure supplement 1. TDP-43 is expressed by wild-type (WT) Schwann cells and specifically ablated from the conditional knockout (cKO) Schwann cells.

Figure 1—figure supplement 1.

(A) Single-channel images and the merged image with DAPI nuclear staining for Figure 1A. Scale bar, 10 μm. (B) Immunostaining of P3 WT and cKO sciatic nerves for TDP-43 (green) and Sox10 (red). Sox10 labels Schwann cells, which are all TDP-43-negative in the cKO. The cell types other than Schwann cells are Sox10-negative and are still TDP-43-positive in the cKO. Scale bar, 10 μm. (C) Immunostaining of P28 WT and cKO sciatic nerves for TDP-43 (green), PDGFRα (red), and DAPI (blue). PDGFRα labels endoneurial fibroblasts, which are TDP-43-positive in the cKO. Scale bar, 10 μm. cKO by Dhh-Cre (A–C).
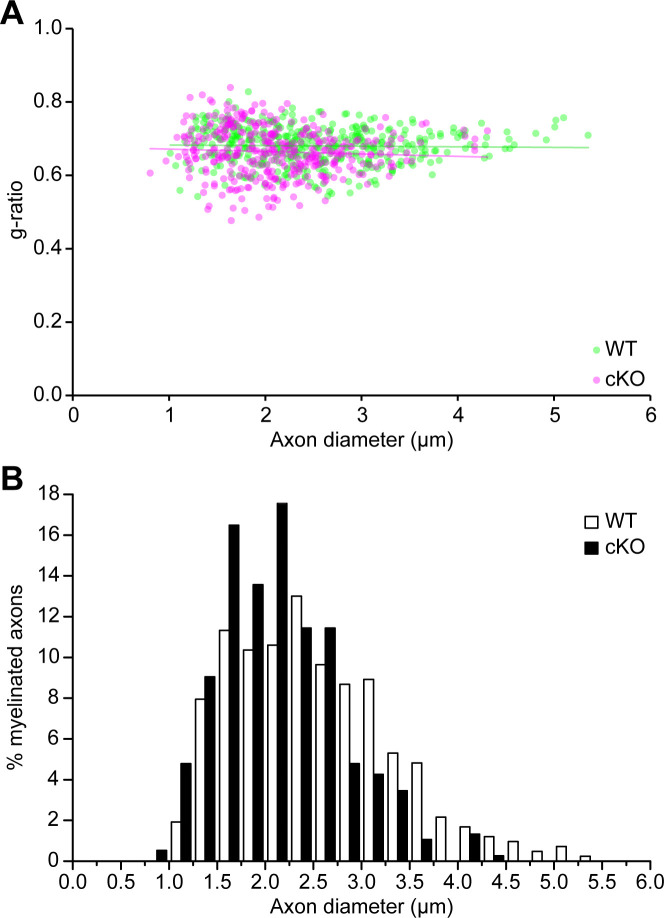
Figure 1—figure supplement 2. Quantification for the myelin thickness and axon diameters of myelinated axons in the TDP-43-cKO sciatic nerves.

Figure 1—figure supplement 2.

(A) The scatter plot showing the g-ratios (y-axis) in relation to the axon diameters (x-axis) of individual myelinated axons in P21 wild-type (WT) and conditional knockout (cKO) sciatic nerves. The g-ratio was calculated as axon diameter/(axon diameter + myelin thickness ×2). Average g-ratios (mean ± SEM): WT = 0.6809 ± 0.0066; cKO = 0.6640 ± 0.0009. Unpaired two-tailed t-test: p=0.1214. (B) The histogram showing the frequency of different axon populations in each axon diameter range. n = 3 mice (totally 415 axons) for WT; n = 3 mice (totally 376 axons) for cKO. More than 100 axons per mouse were analyzed.