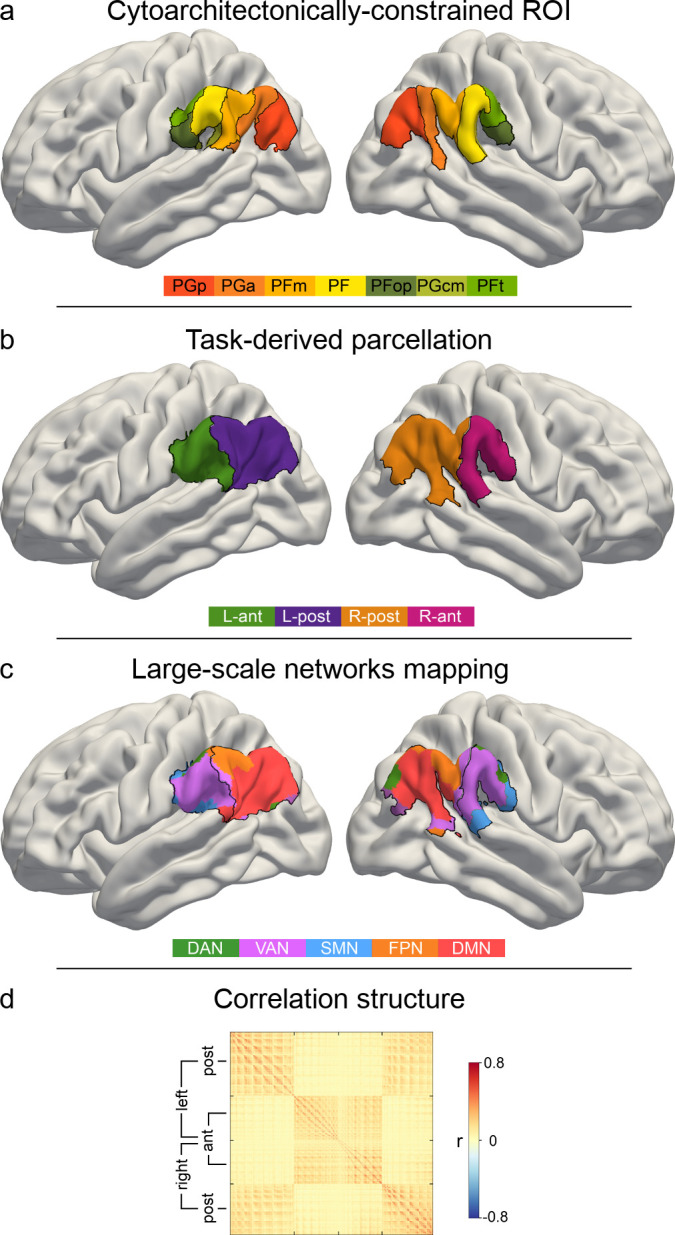
Figure 2. IPL parcellation extracted from neural activity responses across attention, semantics, and social cognition.
Neural activity estimates from all three task experiments were pooled to achieve a data-driven segregation of the inferior parietal lobe, separately in each hemisphere. (a) Cytoarchitectonic boundaries defined the contours of our region of interest (ROI) (Zilles and Amunts, 2010). (b) The derived ROI was submitted to automatic parcellation into subregions to capture neural activity profiles of the three domains in each hemisphere. L-ant: left anterior subregion. L-post: left posterior subregion. R-ant: right anterior subregion. R-post: right posterior subregion. (c) Mapping of large-scale brain networks (Yeo et al., 2011) to the ROI. Posterior subregions are predominantly populated by the default mode network (DMN), while the anterior regions mainly host the ventral attention network (VAN). DAN: dorsal attention network. FPN: fronto-parietal network. SMN: somatomotor network. (d) Similarity matrix of voxel-wise neural activity estimates of single trials, reordered according to (c). The similarity structure reproduces the parcellation results.

Figure 2—figure supplement 1. The final subregion solution shows a high degree of symmetry between hemispheres.


