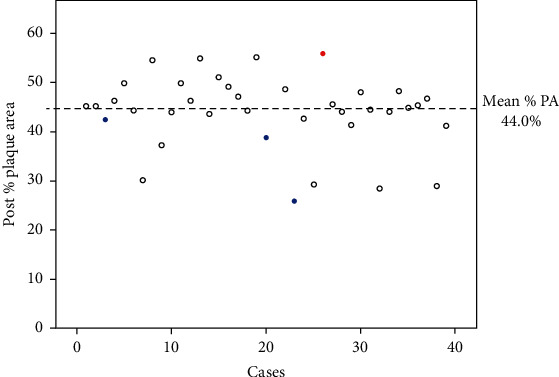
Figure 1.

Distribution of % PA after DCA for each case. Mean %PA in the overall population was 44.0%. The red dot shows ischemia-driven TLR case at 12 months for the de novo LM bifurcation lesion after DCA. The blue dots show ischemia-driven TLR cases at 12 months for stent edge restenosis at the LAD ostium after DCA.
