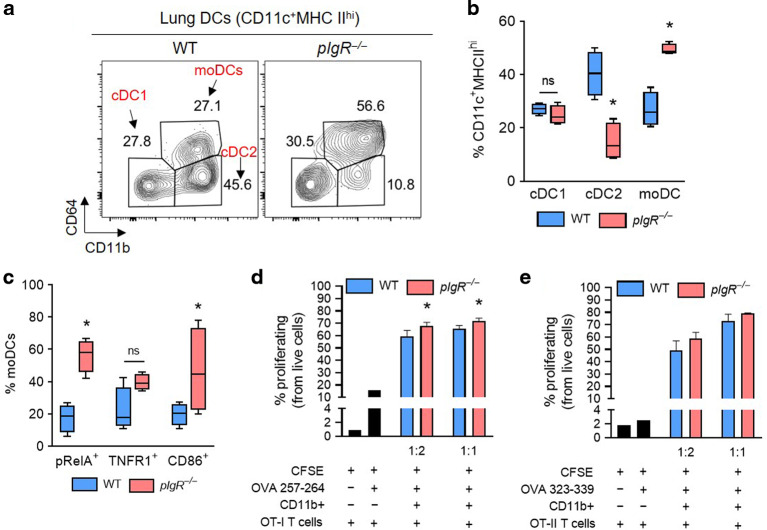
Fig. 4. Activated moDCs accumulate in the lungs of pIgR−/− mice.
a Representative flow cytometry plot showing the distribution of cDC1, cDC2, and moDCs in the lungs of an 18-month-old WT and pIgR−/− mouse (from CD11c+MHC IIhi cells). b Percentage of cDC1, cDC2, and moDCs among CD11c+MHCIIhi cells in 18-month-old WT and pIgR−/− mice shown in (a). c Percentage of moDCs expressing the activation markers pRelA, TNFR1, and CD86 in 18-month-old WT and pIgR−/− mice. d, e Percentage proliferating OT-I (d) or OT-II (e) splenic T lymphocytes co-cultured with lung CD11b+ cells from 18-month-old WT or pIgR−/− mice at the ratios indicted (CD11b+ cells to T cells) in the presence of OVA peptide. b, c *p < 0.01 compared to 18-month-old WT mice (t-test); n = 4 mice/group. d *p < 0.05 for trend (1-way ANOVA); n = 3 biological replicates (CD11b+ cell donors)/group and 3 technical replicates per biological replicate. OT-I or OT-II cells came from spleens of a single donor for each experiment. Box-and-whisker plots represent median, interquartile range, and range.

