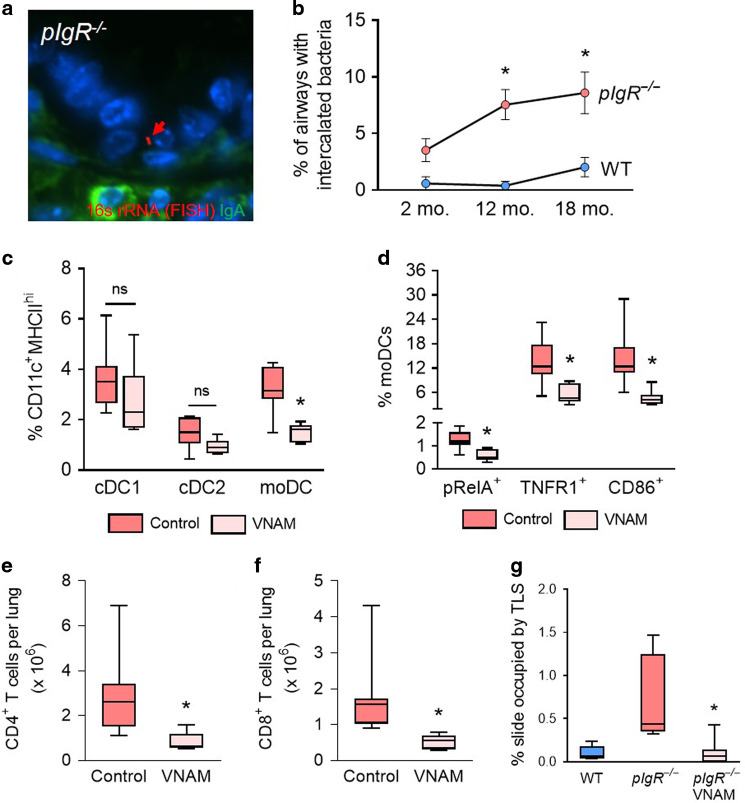
Fig. 6. Antimicrobial therapy reduces activated moDC and T lymphocyte numbers in pIgR−/− mice.
a Representative in situ hybridization (FISH) of bacterium invading the epithelial barrier in a small airway from an 8-month-old pIgR−/− mouse. The bacterium (red arrow) is labeled by a FISH probe targeting prokaryotic 16s rRNA. IgA staining (green) shows absence of SIgA on the airway surface. b Percentage of airways with bacteria intercalated into the mucosa in WT and pIgR−/− mice at indicated ages. c Quantification of moDCs, cDC1, and cDC2 cells (as % CD11c+MHCIIhi cells) in aged pIgR−/− mice with and without antibiotics (vancomycin, neomycin, ampicillin, metronidazole, VNAM) treatment. d Percentage of moDCs (CD11c+MHCIIhiCD11b+CD64+) expressing the activation markers pRelA, TNFR1, and CD86 in the lungs of aged pIgR−/− mice with and without antibiotic treatment. e, f Quantification of CD4+ and CD8+ T lymphocytes in the lungs of aged pIgR−/− mice with and without antibiotic treatment. g Percentage of slide occupied by TLS in 18-month-old untreated WT and pIgR−/− mice and 18-month-old pIgR−/− mice treated with antibiotics. b *p < 0.01 compared to age-matched WT mice (2-way ANOVA with Bonferroni post hoc test); n = 5–11 mice/group. c *p < 0.01 compared to untreated pIgR−/− mice (2-way ANOVA with Bonferroni post hoc test); n = 6–8 mice/group. d–e *p < 0.05 compared to untreated pIgR−/− mice (t-test); n = 6–8 mice/group. Box-and-whisker plots represent median, interquartile range, and range. f *p < 0.001 compared to untreated pIgR−/− mice (Mann–Whitney test); n = 6–8 mice/group. g *p < 0.01 compared to untreated pIgR−/− mice (Mann–Whitney test); n = 6–8 mice/group.

