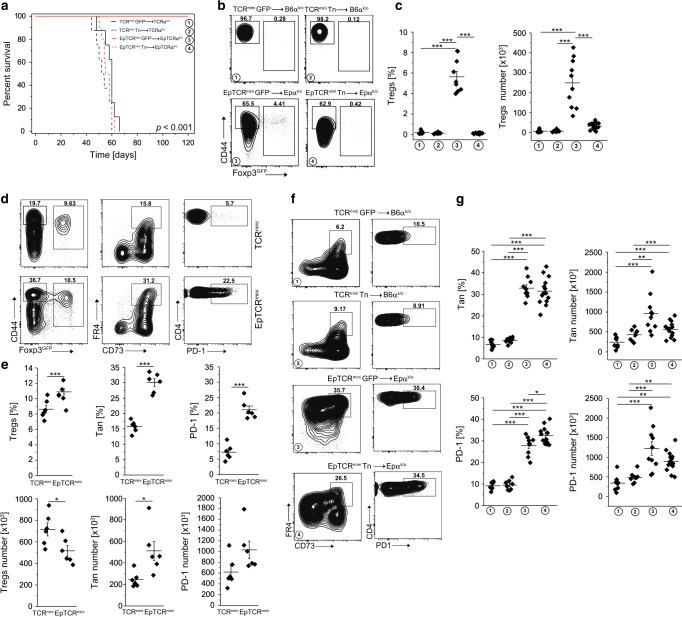
Fig. 3. Conversion of Tan cells to pTregs saves lymphopenic recipients from lethal cachexia.
a Survival of lymphopenic TCRαk/o or EpTCRαk/o mice after transfer of CD4+Foxp3GFP− or naïve CD4+CD44−Foxp3GFP− cells from indicated donors (for CD4+CD44−Foxp3GFP− and CD4+Foxp3GFP− TCRmini donors n = 8, for CD4+CD44−Foxp3GFP− cells from EpTCRmini n = 10 and for CD4+Foxp3GFP− cells n = 14). b Expression of Foxp3 and CD44+ on transferred cells. c Proportions and the total number of Tregs in each recipient. Each symbol represents an individual mouse. d Representative analysis of TCRmini and EpTCRmini mice. Frequencies of Tregs (left plots), Tan (middle plots) and PD-1 (right plots) splenic CD4+ cells are shown and are summarized in e (each symbol shows individual mouse, n = 6 of each type). f FACS plots show data generated in a and b. Frequencies of Tan (left) and PD-1 (right) of CD4+Foxp3GFP− cells are shown. g Summary of data from f. Each symbol depicts an individual mouse. Statistical significance was calculated with ANOVA with Bonferroni correction (c, g) or paired Student t test (e). *p < 0.05, **p < 0.01, ***p < 0.001.

