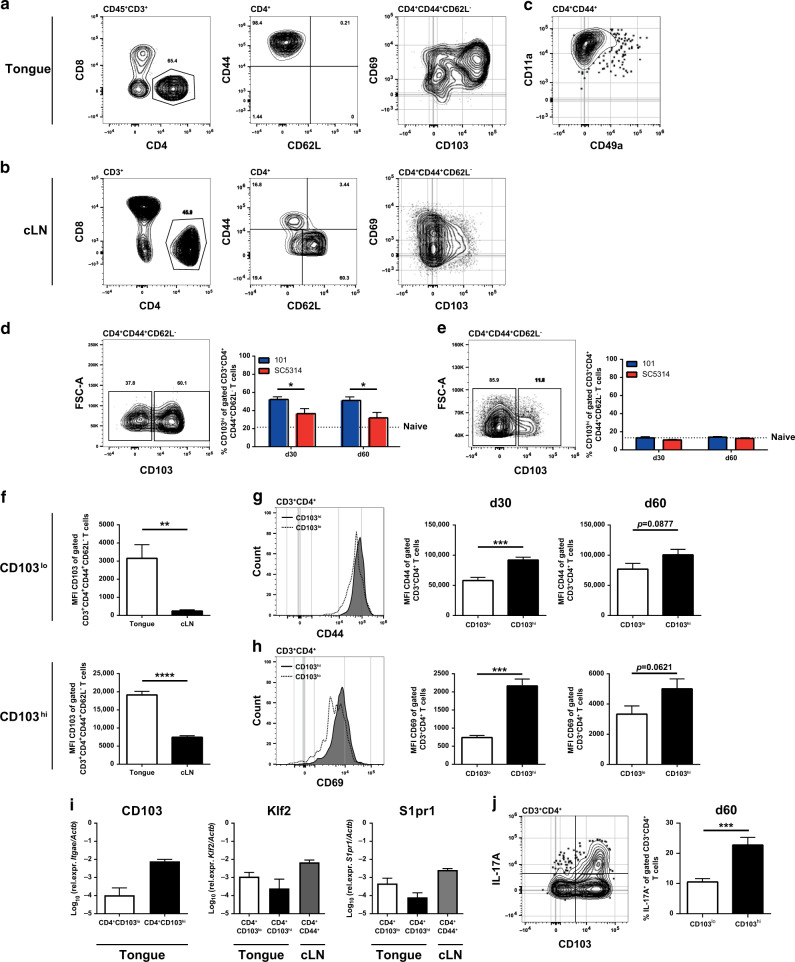
Fig. 3. Tongue CD4+ T cells share phenotypic characteristics with TRM cells.
WT mice were infected sublingually with C. albicans strain 101 (blue) or strain SC5314 (red) for the indicated time points. a–c CD3+CD4+ T cells from the tongue (a, c) and the cervical lymph nodes (cLN, b) were analyzed by flow cytometry for CD44, CD62L, CD69, CD103, CD11a, and CD49a expression. Representative FACS plots show the situation in strain 101-infected mice on day 60 post infection. d, e CD44+CD62L−CD3+CD4+ T cells in the tongue (d) and the cervical lymph nodes (cLN, e) were divided into CD103hi and CD103lo subsets. Representative FACS plots (left) show the situation in strain 101-infected mice on day 60 post infection. Summary graphs (right) represent the mean + SEM of 6–13 individual mice per group pooled from 3–4 independent experiments. The dotted line represents the mean value determined in naive mice. f The mean fluorescence intensity (MFI) of the CD103 staining was analyzed in the CD103lo (top) and CD103hi (bottom) subsets of CD44+CD62L−CD3+CD4+ T cells in the tongue and the cervical lymph nodes (cLN). The MFI of the CD44 (g) and CD69 staining (h) was analyzed in the CD103hi and CD103lo subsets of tongue CD3+CD4+ T cells. Representative FACS plots (left) show the situation on day 60 post infection. Summary graphs (middle and right) represent the mean + SEM of 7–13 individual mice per group pooled from 2–3 independent experiments. i Tongue CD4+CD103hi and CD4+CD103lo T cell subsets and cervical lymph node (cLN) CD4+CD44+ T cells were sorted from strain 101-infected animals on day 60–90 post infection and Klf2 and S1pr1 transcripts were quantified by RT qPCR. Itgae transcripts (coding for CD103) were quantified in the tongue TRM subsets as a control. Each bar represents the mean + SEM of 2–3 samples that were obtained by pooling the tongues or cervical lymph nodes from five mice each. j IL-17 production by tongue CD4+CD103hi and CD4+CD103lo T cell subsets was analyzed by flow cytometry on day 60 post infection and after ex vivo re-stimulation with PMA and ionomycin for 4 h in the presence of Brefeldin A. A representative FACS plot is shown on the left; quantification of the frequency of IL-17+CD3+CD4+ T cells in the tongue is shown on the right. Each bar represents the mean + SEM of five individual mice per group pooled from two independent experiments. Statistics were calculated using two-way ANOVA (d, e) or t-test (f–h, j), *p < 0.05, **p < 0.01, ***p < 0.001, ***p < 0.0001. See also Supplementary Figs. S3 and S4.

