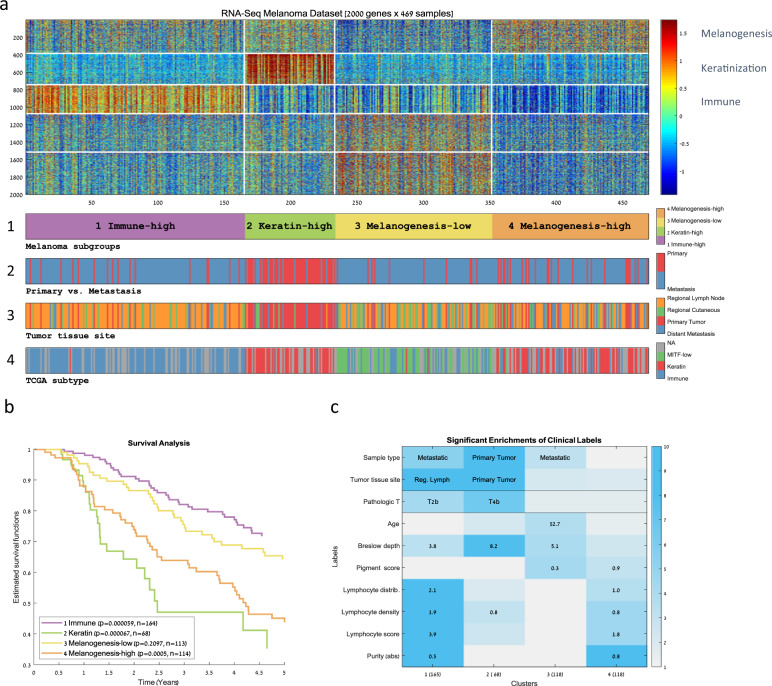
Fig. 1. Clustering of TCGA’s RNA-Seq melanoma dataset.
a A heat map representing the clustering of 469 melanoma samples (matrix columns) into four groups based on the 2000 genes with the most variable expression profiles (matrix rows). Each sample cluster represents a group of similar melanoma tumors. Genes were also clustered in order to identify groups of coexpressed genes. Both samples and genes were clustered using the k-means algorithm (using k = 4 for the samples and k = 5 for the genes). The bars below the matrix display sample labels: (1) cluster ID, (2) primary versus. metastasis, (3) tissue site, and (4) TCGA transcriptomic subtype. b Kaplan–Meier curves for the four sample clusters. Log-rank p values appear in the legend. c Summary of the significant enrichments on sample clusters (columns) for clinical labels (rows). The value within each cell specifies the most significant enrichment based on the hypergeometric distribution. Cells are colored by enrichment significance in −log10 scale.

