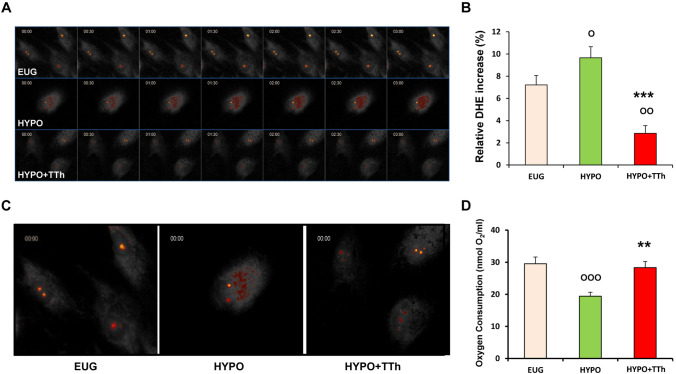
Fig. 10.
a Displays representative time-lapse images of hPADs isolated from EUG, HYPO and HYPO + TTh patients, stained with 10 μM dihydroethidium (DHE) and imaged for 3 min. b Bar graph shows the changes in integrated fluorescence intensity measured in the nuclei of hPADs during time-lapse imaging. c Shows a higher magnification of DHE-derived fluorescence in each group. Panel D shows the oxygen consumption in hPADs isolated from EUG, HYPO and HYPO + TTh patients after 10 days of spontaneous differentiation. It was measured by the Oxygraph system instrument. The bar graph shows the ratio of oxygen consumption normalized per mL of cell volume. Data are reported as the mean ± SEM. of at least three independent experiments. Op < 0.05, OOp < 0.01, OOOp < 0.001 vs. Eugonadal; **p < 0.01, ***p < 0.001 vs. Hypogonadal

