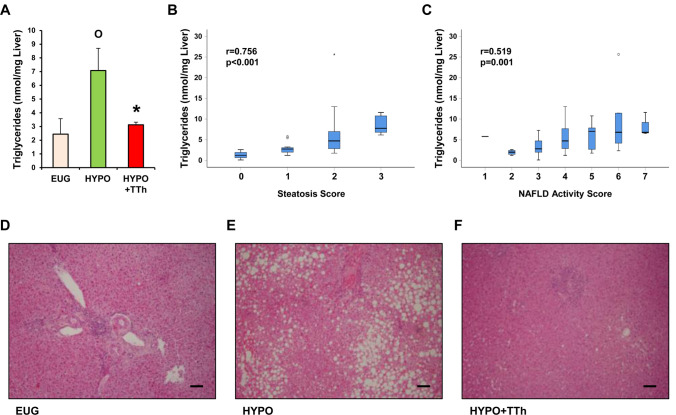
Fig. 4.
a Bar graph shows liver triglyceride levels obtained from liver biopsies in all three groups of patients. b, c Display the correlation of liver triglyceride levels with steatosis and NAS scores, respectively. d–f Show the H&E staining of liver sections from eugonadal (EUG), hypogonadal (HYPO) and hypogonadal subjects treated with testosterone (HYPO + TTh), respectively. Op < 0.05 vs. Eugonadal; *p < 0.05 vs. Hypogonadal; Scale bar 100 μm

