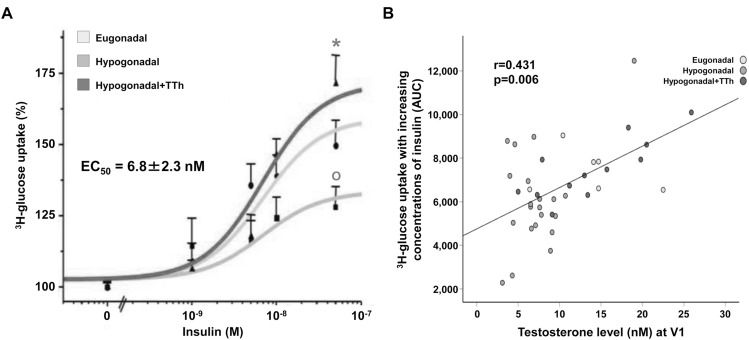
Fig. 8.
Panel A shows the insulin dose-dependent 3H-2-deoxy-d-glucose uptake in hPADs from all groups after exposure (30 min) to increasing concentrations of insulin. Results are expressed in percentage over baseline (no insulin) and are reported as mean ± SEM of four different experiments, each performed in duplicate and using a different cell preparation per group. b Shows the glucose uptake AUC correlation with total testosterone levels at pre-surgery V1 [AUC: incremental area under the curve of glucose blood level during oral glucose tolerance test (OGTT)]. Op < 0.05 vs. Eugonadal; *p < 0.05 vs. Hypogonadal

