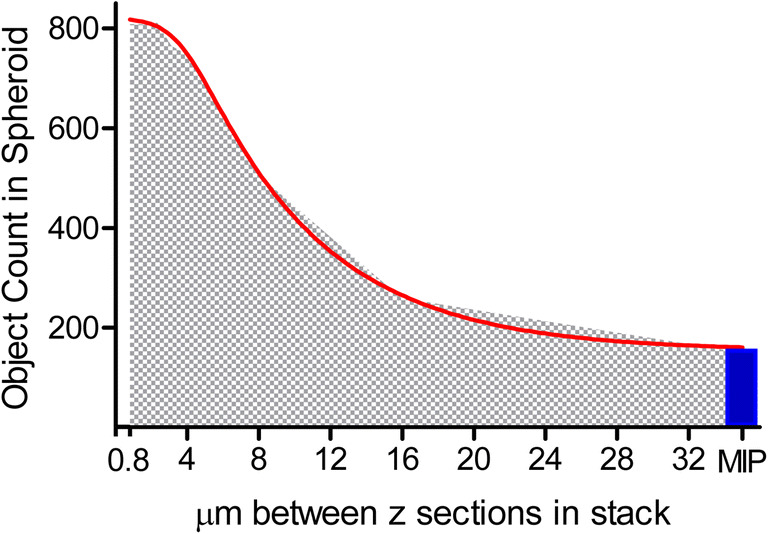
Figure 10.

The quantitative image analysis segmentation of CHO spheroid illustrates missed nuclei counts when z-slice intervals increase in 3D volumetric image analysis segmentation or when compared to 2D image analysis of maximum intensity projection (MIP); spheroid image includes 301 individual slices at a minimum of 0.8-μm interval spacing from a 20xW lens. X-axis represents micron spacing between z-stack starting at 0.8 μm and doubling up to 32-μm spacing per slice; y-axis indicates the number of volumetric nuclei object count in the 3D sphere. Nonlinear regression asymmetric 5-parameter curve fit R2 is 0.9993 with EC50 (1/2 maximum) of 8.798-μm z-interval spacing; graph and data generated in GrapPad Prism.
