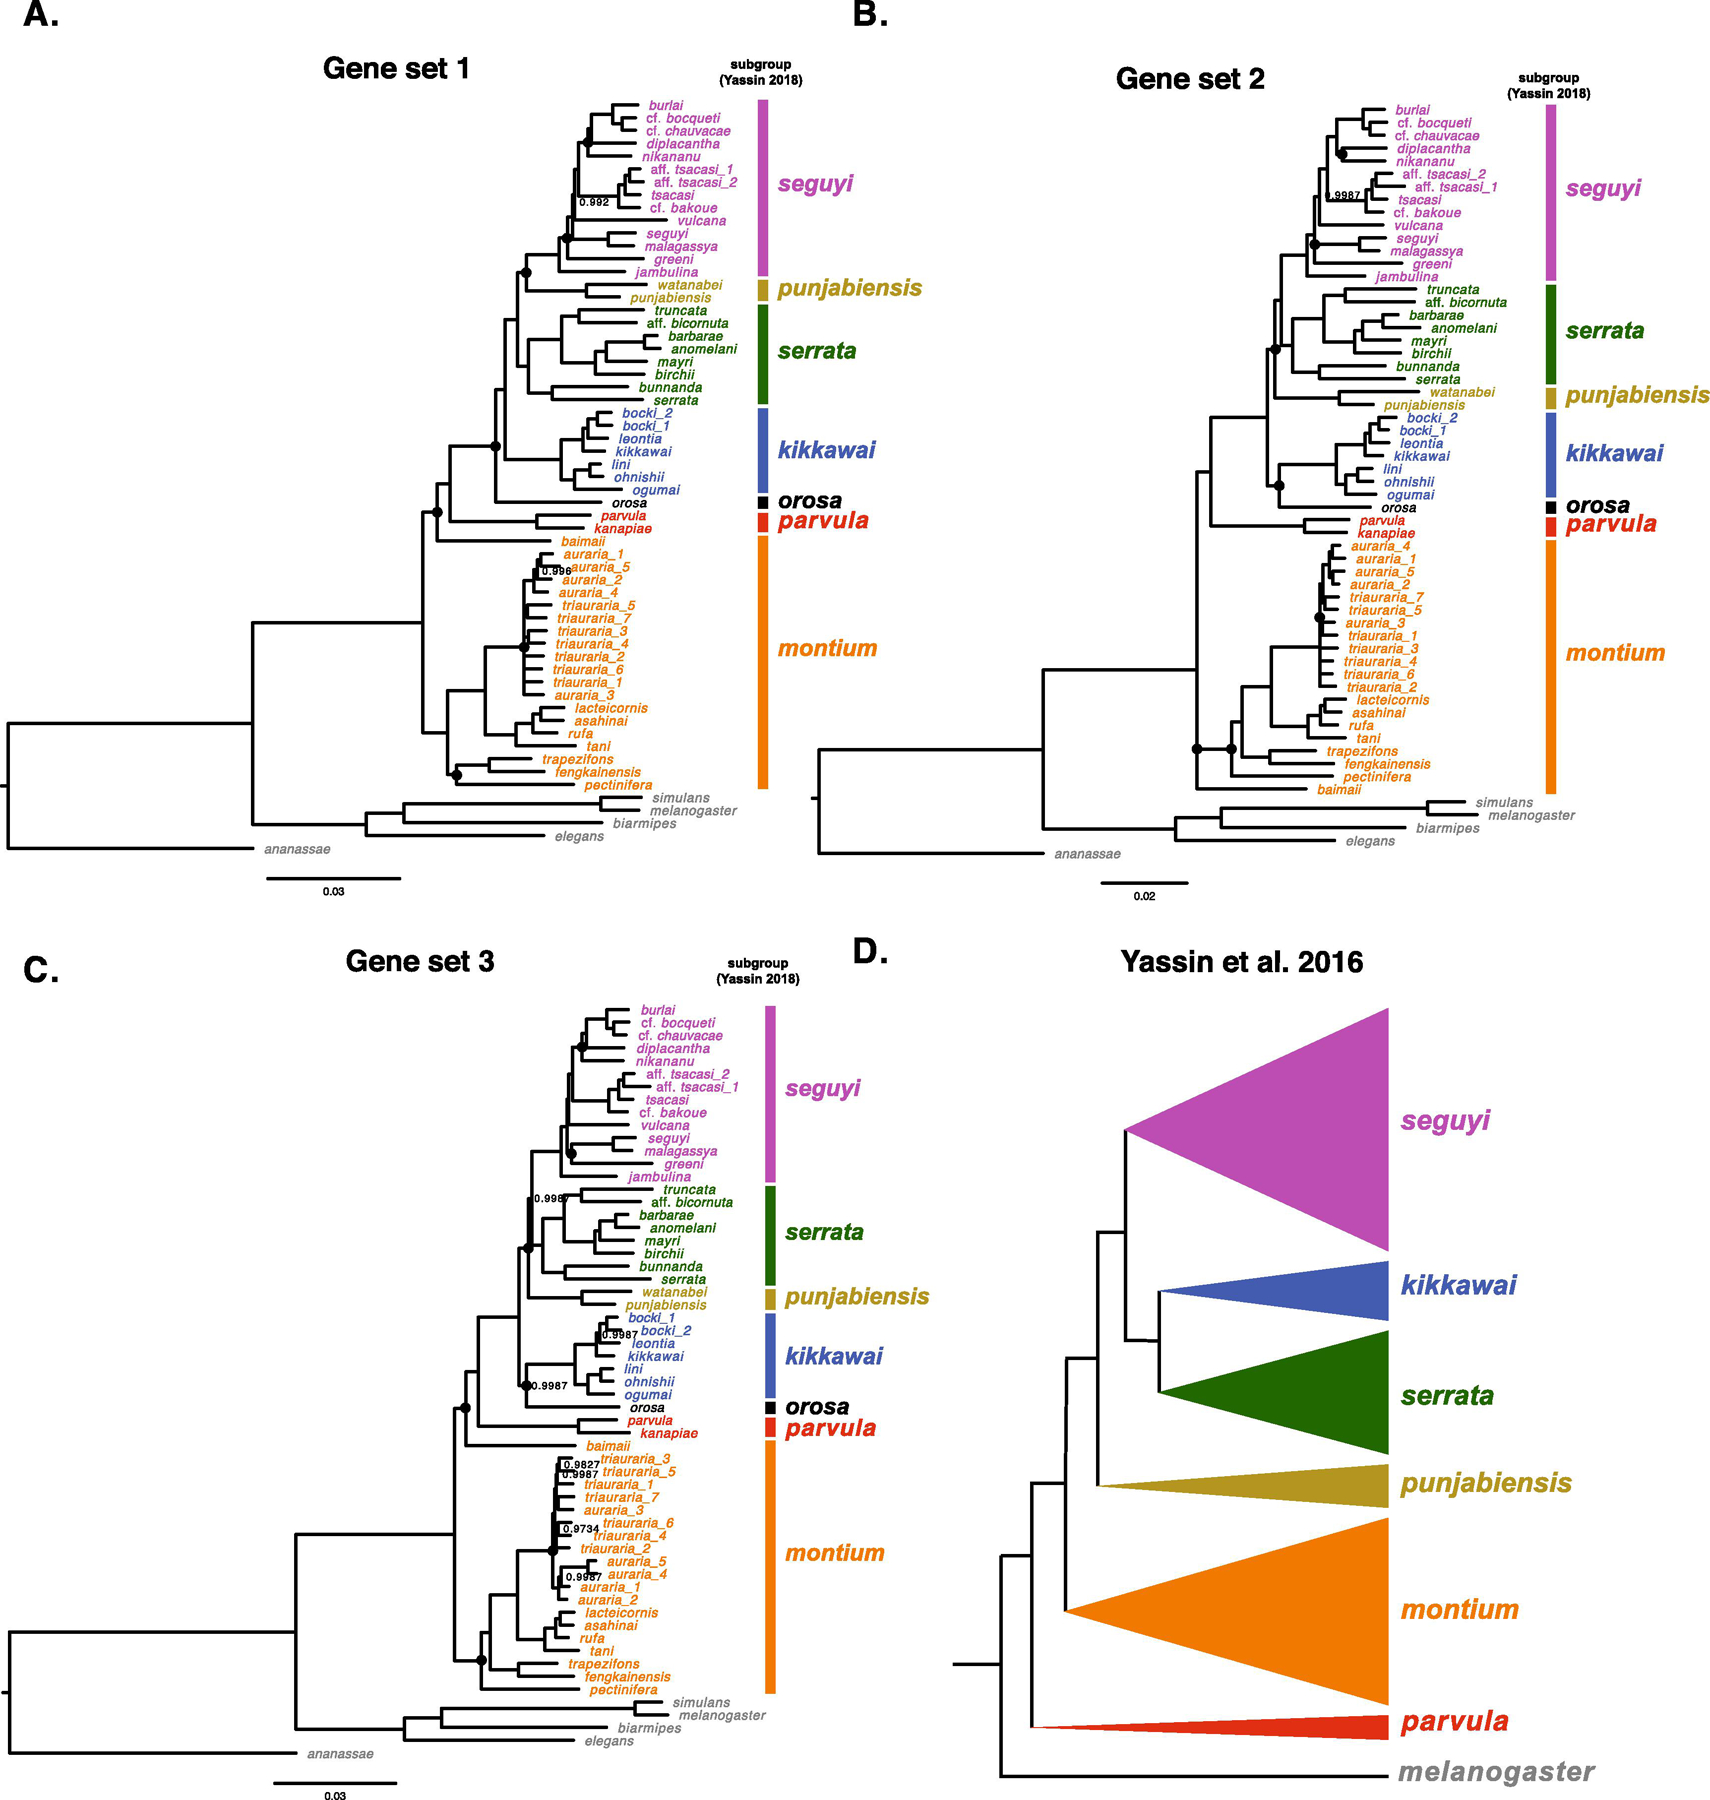
Fig. 1.

Alternative estimates of the D. montium species group phylogeny. Panels A, B and C show the results from three independent Bayesian analyses, each based on concatenated complete coding sequences of 20 nuclear loci, with no overlap among gene sets (Table 1). Panel D shows the relationships of the subgroups within the montium species group proposed by Yassin (2018). In A–C, we label the groups using the same colors as in D. Nodes with posterior probabilities < 0.999 are indicated, and nodes with posterior probabilities below 0.95 are presented as polytomies. Nodes that vary among the three phylogenies in A–C are marked with a black dot. The scale bars show the average number of estimated substitutions per site over the specified branch length.
