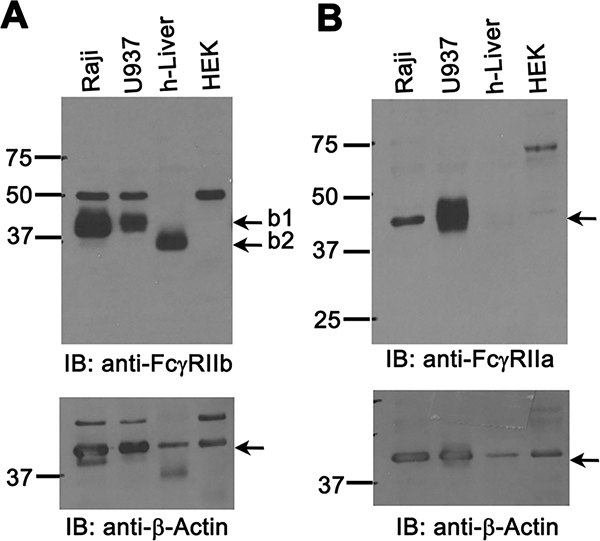
Figure 2. Human liver express more of FcγRIIb than FcγRIIa.
A. An ECL-developed Immunoblot (IB) using rabbit pAb showing FcγRIIb expression in human liver lysates and cell line lysates prepared as described in M&M. Numbers are MW markers in kDa. The IB are representative of data from 3 different human liver samples/biological replicates. B. An ECL-developed IB using rabbit pAb 260 showing FcγRIIa expression in human liver lysates and cell line lysates prepared as described in M&M. Numbers are MW markers in kDa. Numbers are molecular mass markers in kDa. The lower panels of A and B show loading control anti-β-actin. Arrows in top panels point the bands for FcγRIIb isoforms b1 and b2 (Panel A) and FcγRIIa (Panel B).

