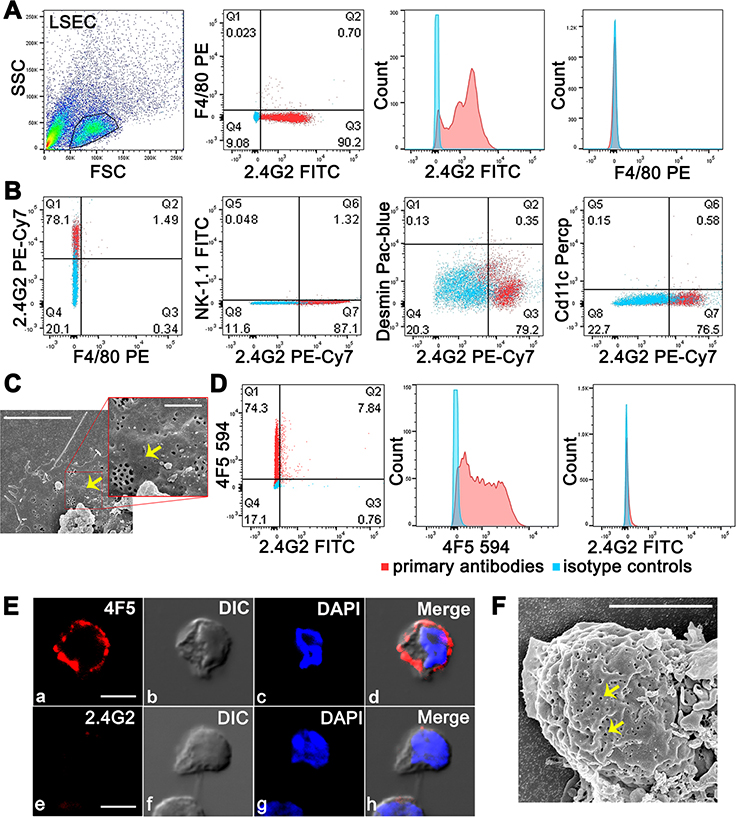
Figure 3. A-C: Flow cytometry analysis confirms purity of isolated mouse LSEC. D-F: LSEC from 2B-KIX mice express human FcγRIIb and not murine FcγRIIb.
A. Representative flow cytometric acquisition plot showing gated LSEC preparation from BALB/c mouse showing two color flow cytometric analysis of 2.4G2 FITC plus F4/80 PE, and histogram representation of single Fluor expression. The results are representative of 4 different experiments and mice/biological replicates. B. Five color flow cytometric analysis of gated LSEC from BALB/c mouse for 2.4G2 PE-Cy7, F4/80 PE, NK-1.1 FITC, Desmin Pac-blue, and Cd11c Percp. Two colors analyzed at one given time are shown in one Figure. C. The picture shows the SEM image of LSEC from a BALB/c mouse. Arrows point fenestrae. The insert projected represents zoomed view. D. Representative two color flow cytometric analysis of gated LSEC from 2B-KIX mouse for 2.4G2 FITC plus 4F5 594 along with histograms showing single colors from 3 different experiments and mice. In A-D, events from isotype controls are represented as blue dots/blue peaks and from primary antibodies as red dots/red peaks. The average percentage of events showing single or double positive expression from three different LSEC preparations is indicated in respective quadrants. E. Confocal microscopic image of LSEC from 2BKIX showing labeling of 4F5 (top row) and 2.4G2 (bottom row) along with DIC and DAPI (nucleus). F. The picture shows the SEM image of LSEC from a 2B-KIX mouse. Arrows point fenestrae. Note folded and layered cell membranes of LSEC. The scale bar in C, E and F indicates 5μm.

