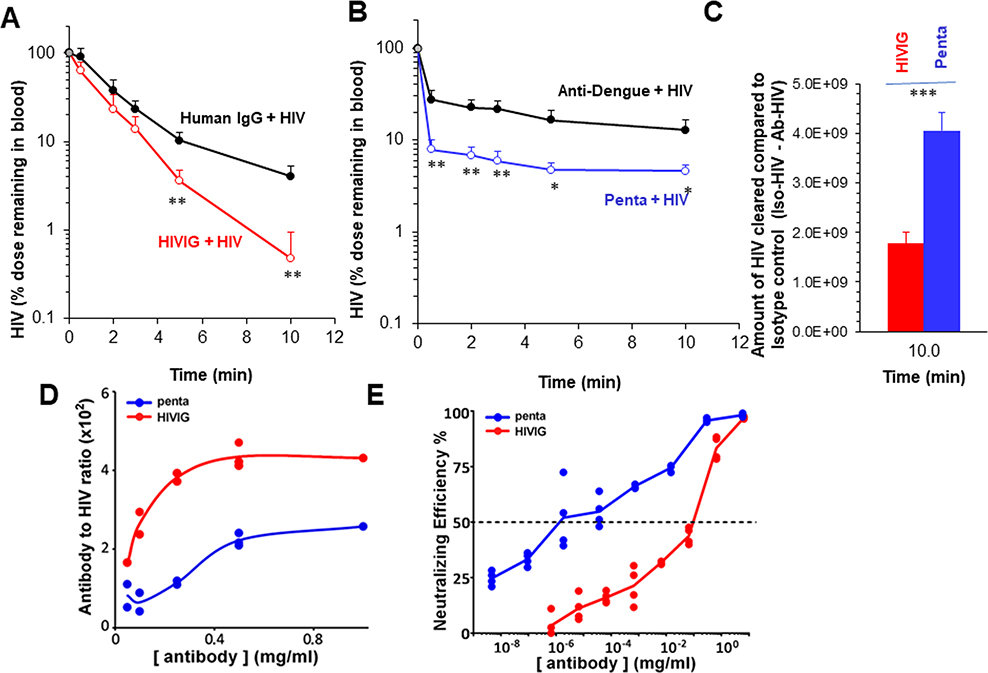
Figure 4. NAbs enhance clearance of HIV from circulation better than HIVIG and Antibody-to-HIV ratio in the immune complexes does not correlate positively with clearance efficiency.
The clearance kinetic curve shows disappearance of Ab-HIV from blood circulation of 2B-KIX mice. Mice were infused by retro-orbital plexus of Ab-HIV prepared using 5×10¹⁰ HIV and 25mg/kg of either HIVIG or pentamix of Nbs along with their isotype controls namely human IgG or Anti-Dengue IgG, respectively as described in M&M. The clearance curve data are representative of two different experiments with each 4 mice per group/biological replicates. Panel A shows clearance of HIVIG-HIV (red open circles) and control human IgG (black closed circles). Panel B shows the clearance of pentamix-HIV (blue open circles) and irrelevant isotype control anti-dengue IgG opsonized HIV (black closed circles). The curve describes the HIV particle numbers in blood per mouse cleared over ten min time ± SD using data averaged from 4 different mice. The data in percentage with assumed blood concentration at time zero as 100%. This was based on the injected dose divided by blood volume of a mouse. C. Plotted curves describe the difference of HIV blood concentrations ± SD between Ab-HIV and the respective control group at 10 min using data averaged from 4 different mice. D. Dose-dependent Ab-HIV binding curves expressing the antibody to HIV ratio for HIVIG (red line) and pentamix (blue line). Representative curves from two different expts (n=2) showing the binding of various concentrations of Alexa-594 labelled Ab to GFP-expressing HIV, which was immobilized on GNA coated plates. The binding ratios were measured and calculated based on the fluorescence units obtained from fluorimeter.
E. Dose-dependent neutralization curves expressing the neutralizing efficiency to HIV for HIVIG (red line) and pentamix of MAbs (blue line). Representative curves from 3 different experiments showing the neutralizing efficiency of various concentrations of antibodies plus 108 infectious HIV particles to the TZM-bl cells. The neutralizing efficiency was measured and calculated based on the luminescence units generated by luciferase reaction from infected cells.
Values of all significant correlations (p<0.05) are given with degree of significance indicated (* p<0.05, ** p<0.01, *** p<0.001) by students t-test.

