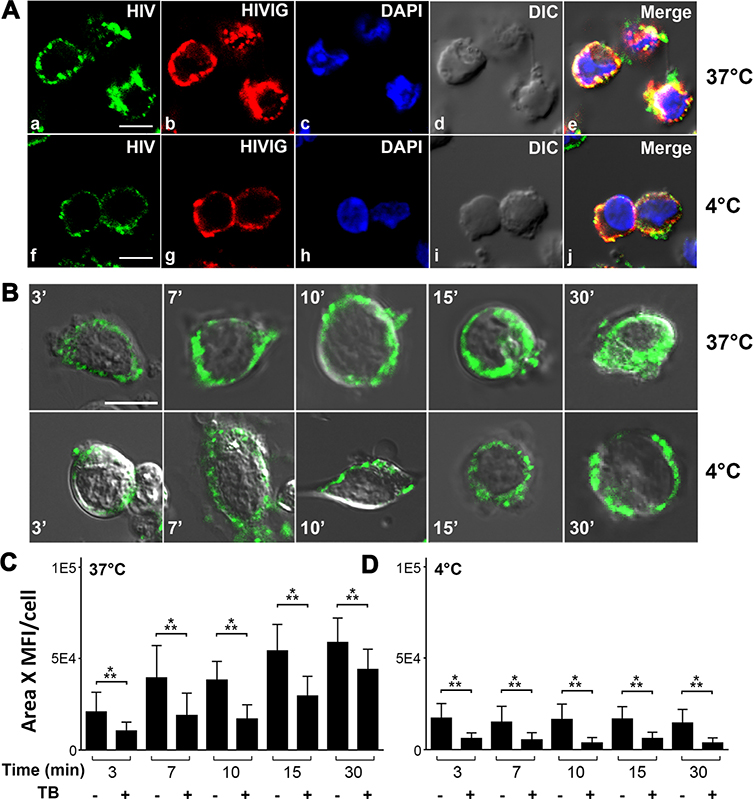
Figure 7. LSEC bind and endocytose HIVIG-HIV Immune complex.
A. Three-color fluorescence microscopic image of PFA fixed LSEC from 2BKIX mice, which where incubated with HIV-488 plus HIVIG-594 immune complex (IC) at 37°C/4°C for 30 min. (a, f) Green puncta identify HIV particles. (b, g) Red puncta identifies HIVIG. (c, h) DAPI (blue) identifies nucleus. (d, i) DIC (e, j) Merged (a)–(d)/(f)–(i). (a-e) Confocal microscopy images showing endocytosis of LSEC at 37°C, (f-j) confocal microscope images showing binding of HIV-488 plus HIVIG-594 IC by LSEC at 4°C. Scale bar indicates 5μm. B. Live cell confocal microscopic image of LSEC from 2B-KIX mice incubated with HIV plus HIVIG-FITC IC for various time points from 3 to 30 min at 37°C (top panel) and 4°C (bottom panel). Green puncta identify HIVIG FITC. C. Bar graph showing quantification of green puncta of HIV plus HIVIG-FITC IC from 25 live cell confocal microscopic images with and without trypan blue is shown here. The mean fluorescence intensity and the total pixel area of green puncta were measured and plotted. A total of 400 LSEC from three different mice/biological replicate were analyzed. Bar graphs show average fluorescence intensity and mean± SD per cell. Values of all significant correlations (p<0.05) are given with degree of significance indicated (* p<0.05, ** p<0.01, *** p<0.001) by students t-test.

