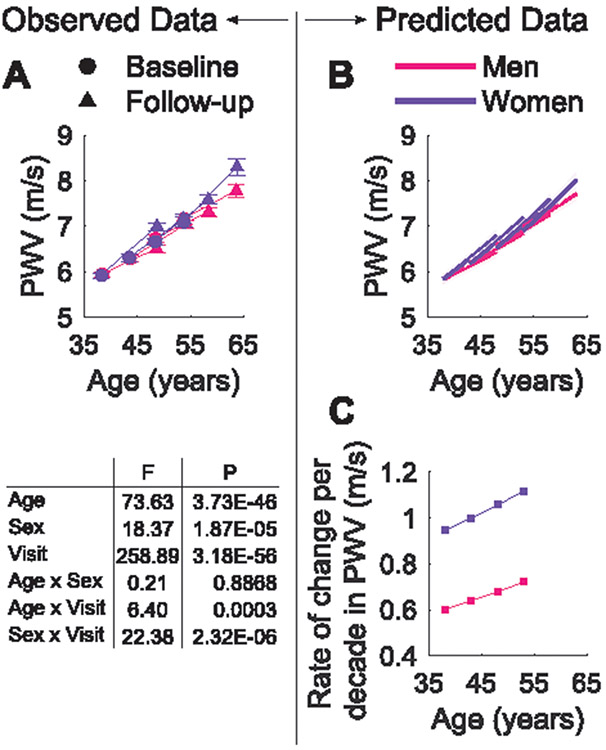
Figure 1.
Observed (A) and predicted (B) longitudinal trajectories in PWV per sex and age strata. Shaded area represents the non-simultaneous 95% confidence intervals. (C) Model-predicted rate of change per decade in PWV for men and women. The plots of the predictions refer to models in Supplemental Table S2. The P and F values in the table indicate the statistical significance of the factors age, sex, visit, and their interaction in the ANCOVA, where PWV was adjusted for MAP. Values of the observations are mean ± SEM.

