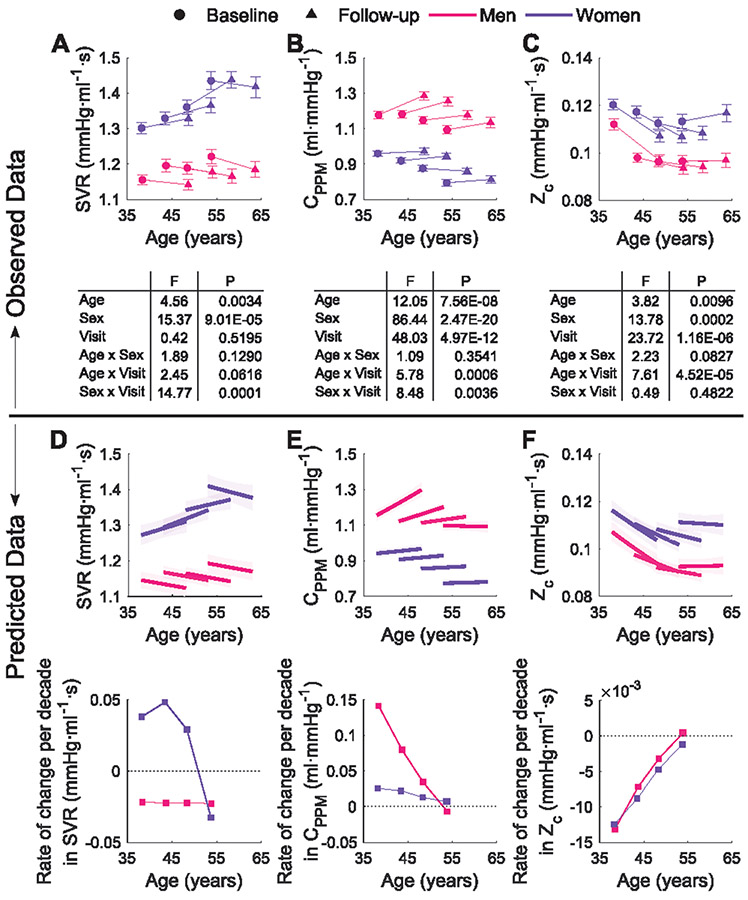
Figure 3.
Top: Observed changes between baseline and follow-up measurements in SVR (A), CPPM (B), and Zc (C) per sex and age strata. Values are mean ± SEM. In the ANCOVA, the three parameters were adjusted for height and weight; CPPM and Zc additionally for MAP. Bottom: Model-predicted longitudinal trajectories and rates of change per decade in SVR (D), CPPM (E), and Zc (F) per sex and age strata. Shaded area represents the non-simultaneous 95% confidence intervals. The plots refer to models in Supplemental Table S5.

