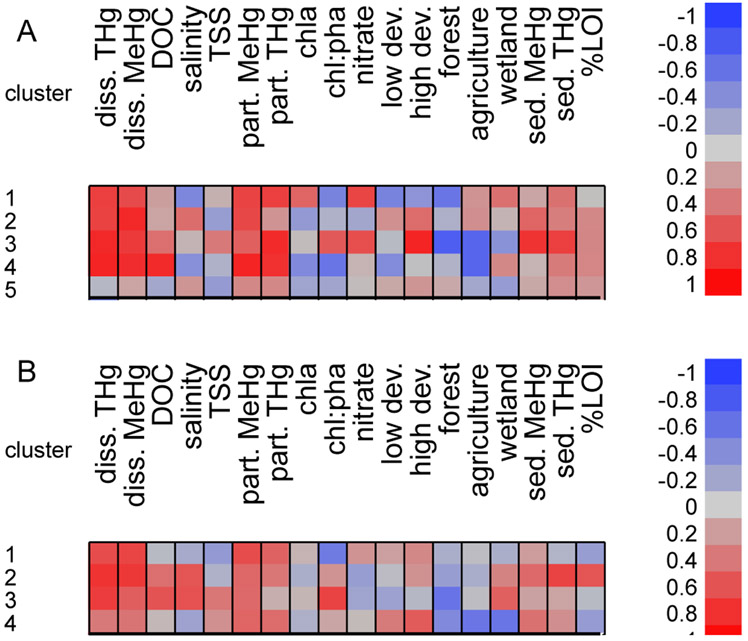
Figure 5:
Heat map of within cluster correlations for Menida THg with environmental variables A) from all sites combined and B) from only uncontaminated sites cluster analysis. Red indicates a positive correlation, blue indicates a negative correlation, and darker colors are a stronger relationship.

