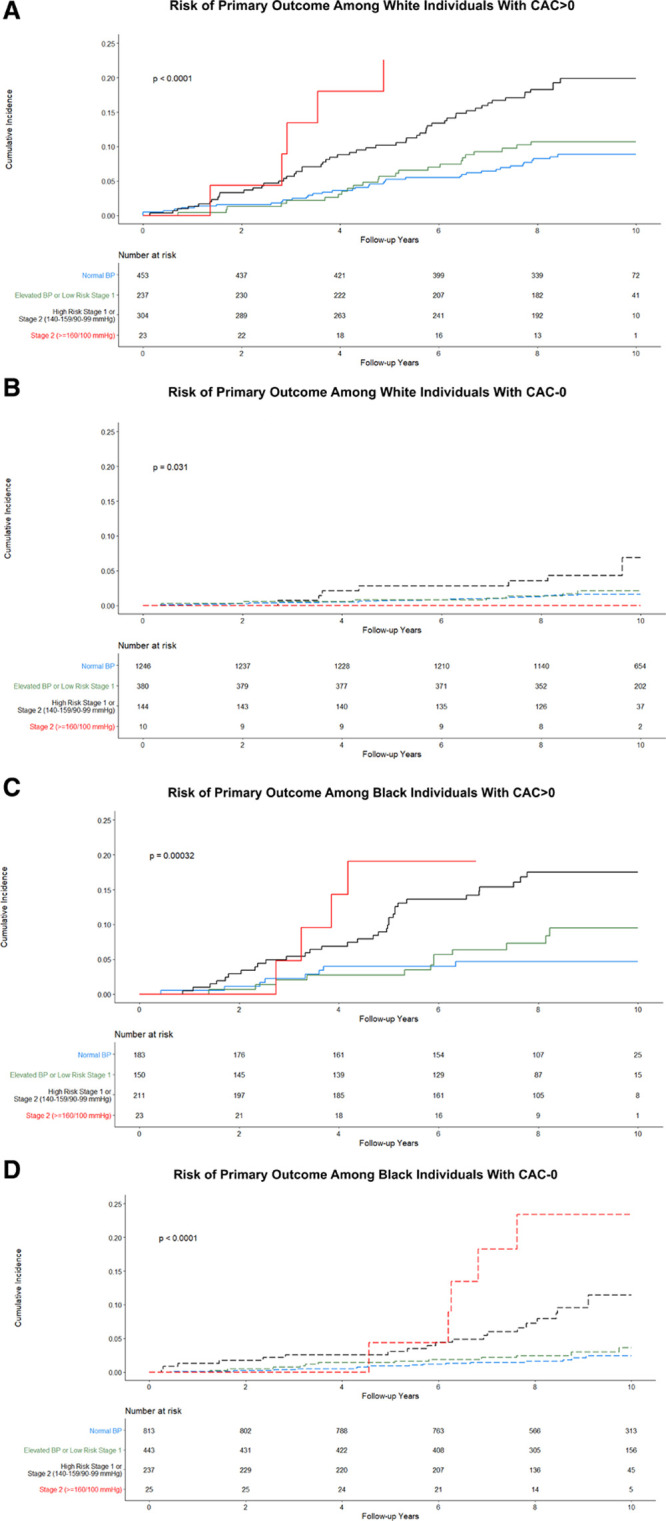
Figure 2.

Race-stratified risk of adverse cardiovascular events by antihypertensive treatment group and coronary artery calcium (CAC) score. A and B, Kaplan-Meier curves for the risk of cardiovascular events stratified by CAC score among White individuals. C and D, Kaplan-Meier curves for the risk of cardiovascular events stratified by CAC among Black individuals. The P values in the Kaplan-Meier Curves represent the log-rank test. BP indicates blood pressure.
