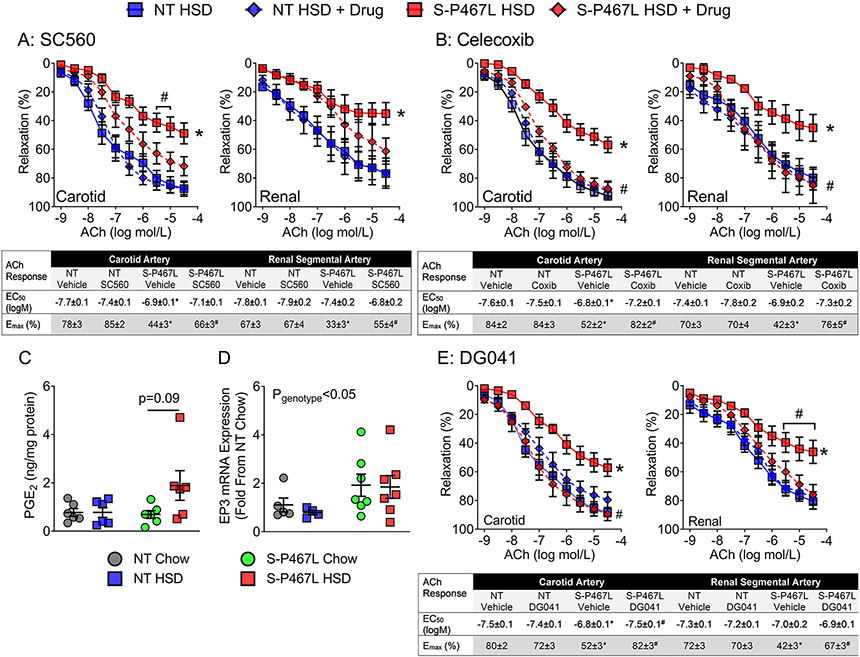
Figure 3. Vasodilation: Roles of the COX-2 and E-Prostanoid-3 Receptor.
A-B) Effects of a selective COX-1 inhibitor SC560 (1 μmol/L) and a selective COX-2 inhibitor Celecoxib (1 μmol/L) on ACh-induced vasodilation in carotid artery and renal segmental arteries (A, n=5-6; B, n=5-6). C) PGE2 content in whole aortas was detected by mass spectrometry at the end of 4 weeks (re-plotted in ng/mg protein from Table 2, Two-way ANOVA Pgenotype: 0.15; Pdiet: 0.09; Pinteraction: 0.10, n=6). D) E-Prostanoid-3 receptor (EP3) gene expression in the aorta at the end of 4 weeks (Two-way ANOVA Pgenotype: 0.04; Pdiet: 0.66; Pinteraction: 0.78, n=4-7 as indicated). The same dataset was re-plotted from Table 1 (group fold change) to show individual fold changes. PGE2 content and EP3 expression were analyzed with two-way ANOVA. The effect of PPARγP467L mutation on EP3 is indicated by Pstrain. E) Dose-dependent vasodilation of carotid artery and renal segmental artery (following precontraction with thromboxane A2 receptor agonist U46619) in response to acetylcholine (n=6). Effects of an EP3 antagonist DG041 (30 min preincubation at 100 nmol/L) were tested. Data are plotted as mean ± SEM. Curves with diamonds denotes drug-treated vessel segments. Curves with squares represent vehicle-treated vessel segments. In vasodilation responses, two-way ANOVA RM was first performed to determine whether two curves there different (main-group effect, denoted by statistical symbols on the right of the curve). When the main-group effect was not significantly different, Tukey’s multiple comparison procedures were performed for comparisons at different concentrations of ACh (statistical symbols above the curves). *p<0.05, S-P467L HSD vs NT HSD; #p<0.05 Drug-treated vs vehicle-treated. Dose response curves were analyzed by nonlinear regression to generate EC50 and Emax values listed in the insets.

