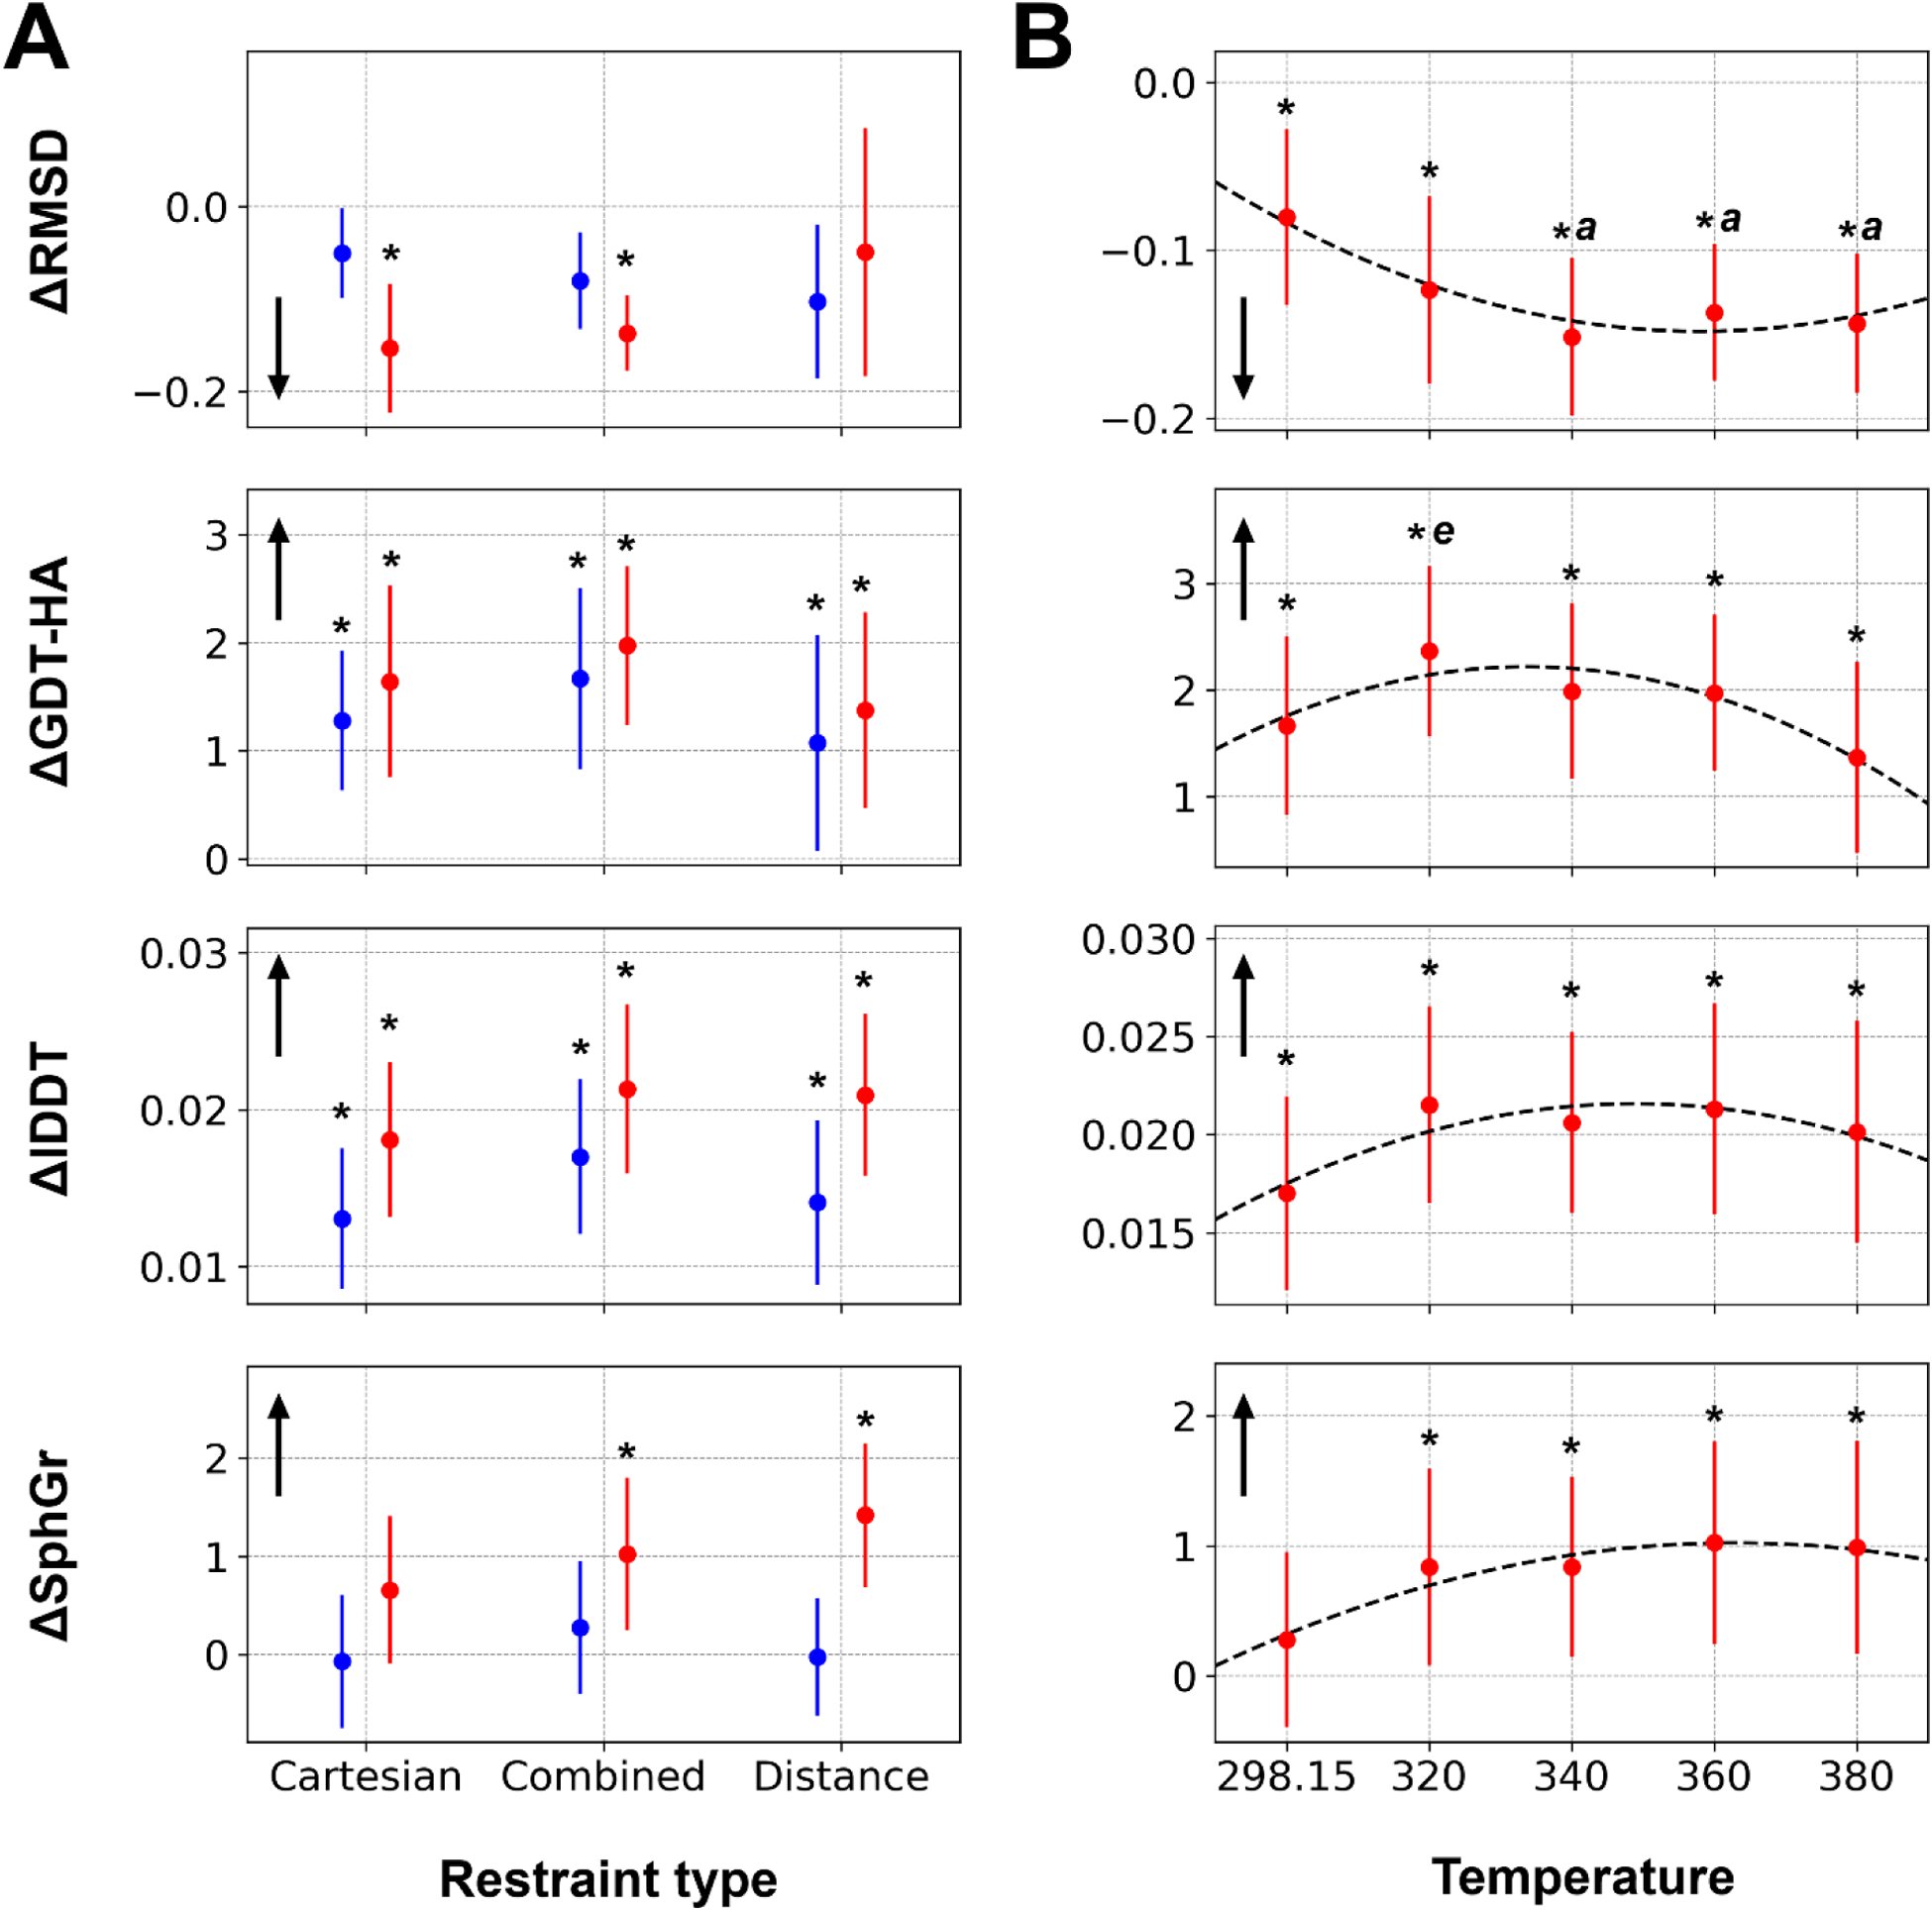
Figure 2. Refinement performance dependence on the MD simulation protocols.

Model quality changes with different restraint types at 298.15 K and 360 K are presented in blue and red, respectively (A). The average values and the target-averaged values of standard deviations from three independent runs are shown as circles and error bars. Refinement results at different MD simulation temperature with the combined restraints are presented in the same way (B). Cubic spline with consideration of the standard deviations are overlaid as dashed lines. Parameters that were statistically significantly improved (p-value < 0.05 from ANOVA test and followed Tukey HSD test) over the initial models are marked with asterisks. Similarly, if a parameter is significantly better than another parameter, it is marked with a letter representing the parameter for which results are compared: r for Cartesian restraints (A); a and e for 298.15 K and 380 K, respectively (B). The direction of improvement for each measure is indicated with a black arrow.
