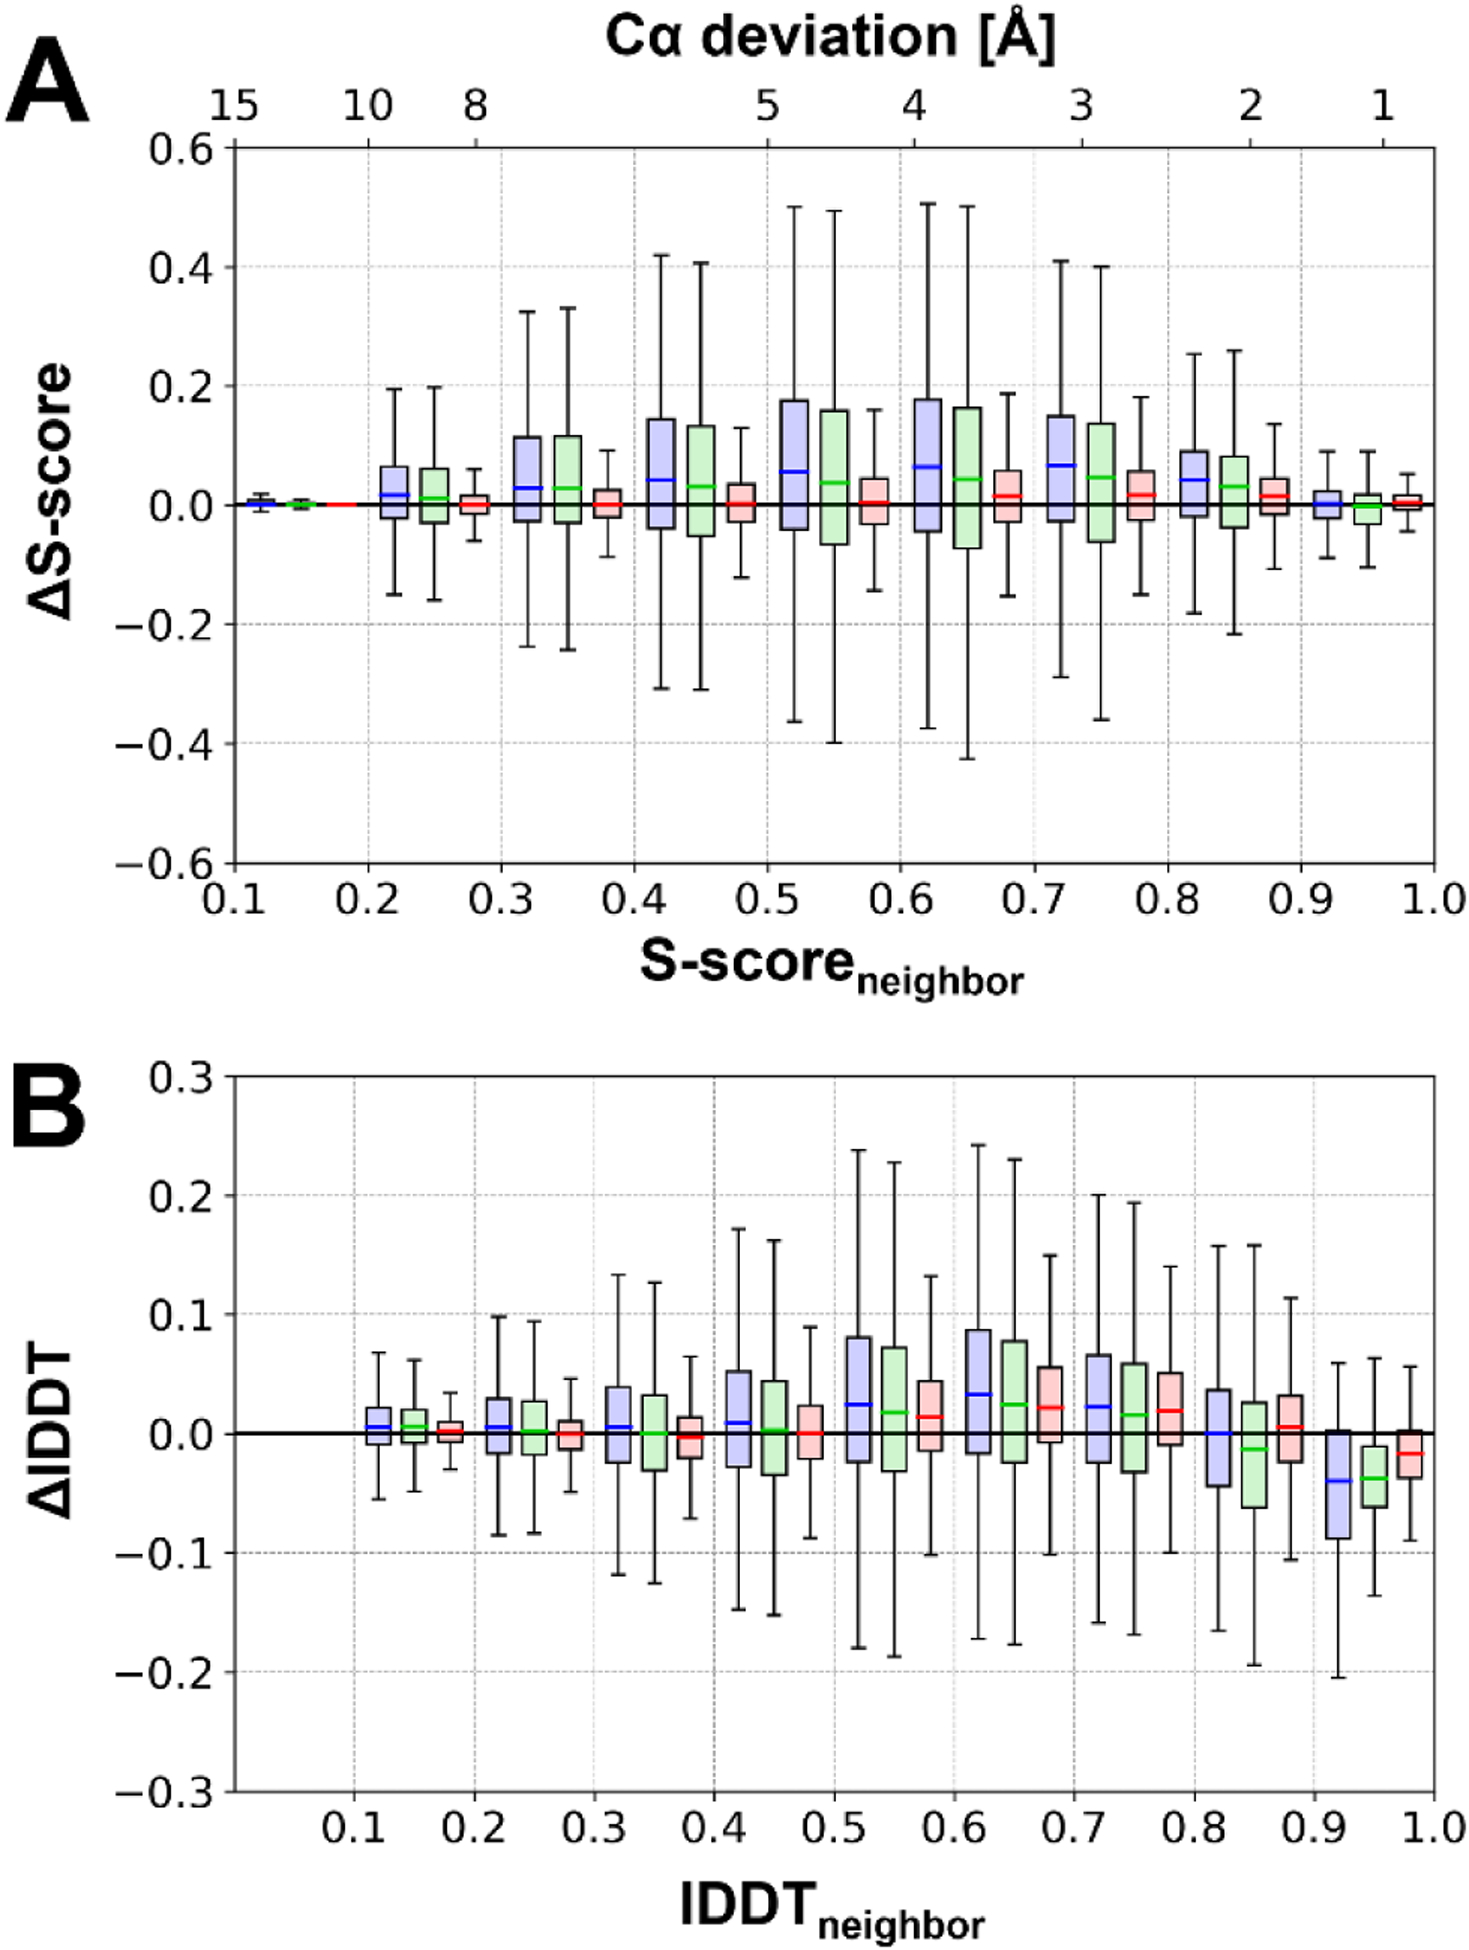
Figure 6. Residue-wise model quality improvements as a function of initial model quality.

Residue-wise model quality changes after refinement as a function of residue-wise initial model quality in terms of S-score (A) and residue-wise lDDT scores (B). Statistical analysis for each bin is shown as a boxplot for refinement with “CASP14” sampling protocol (blue), “CASP13-simple” (green), and “CASP12-simple” (red).
