
Figure 5. Asah2 regulates MDSC ferroptosis.
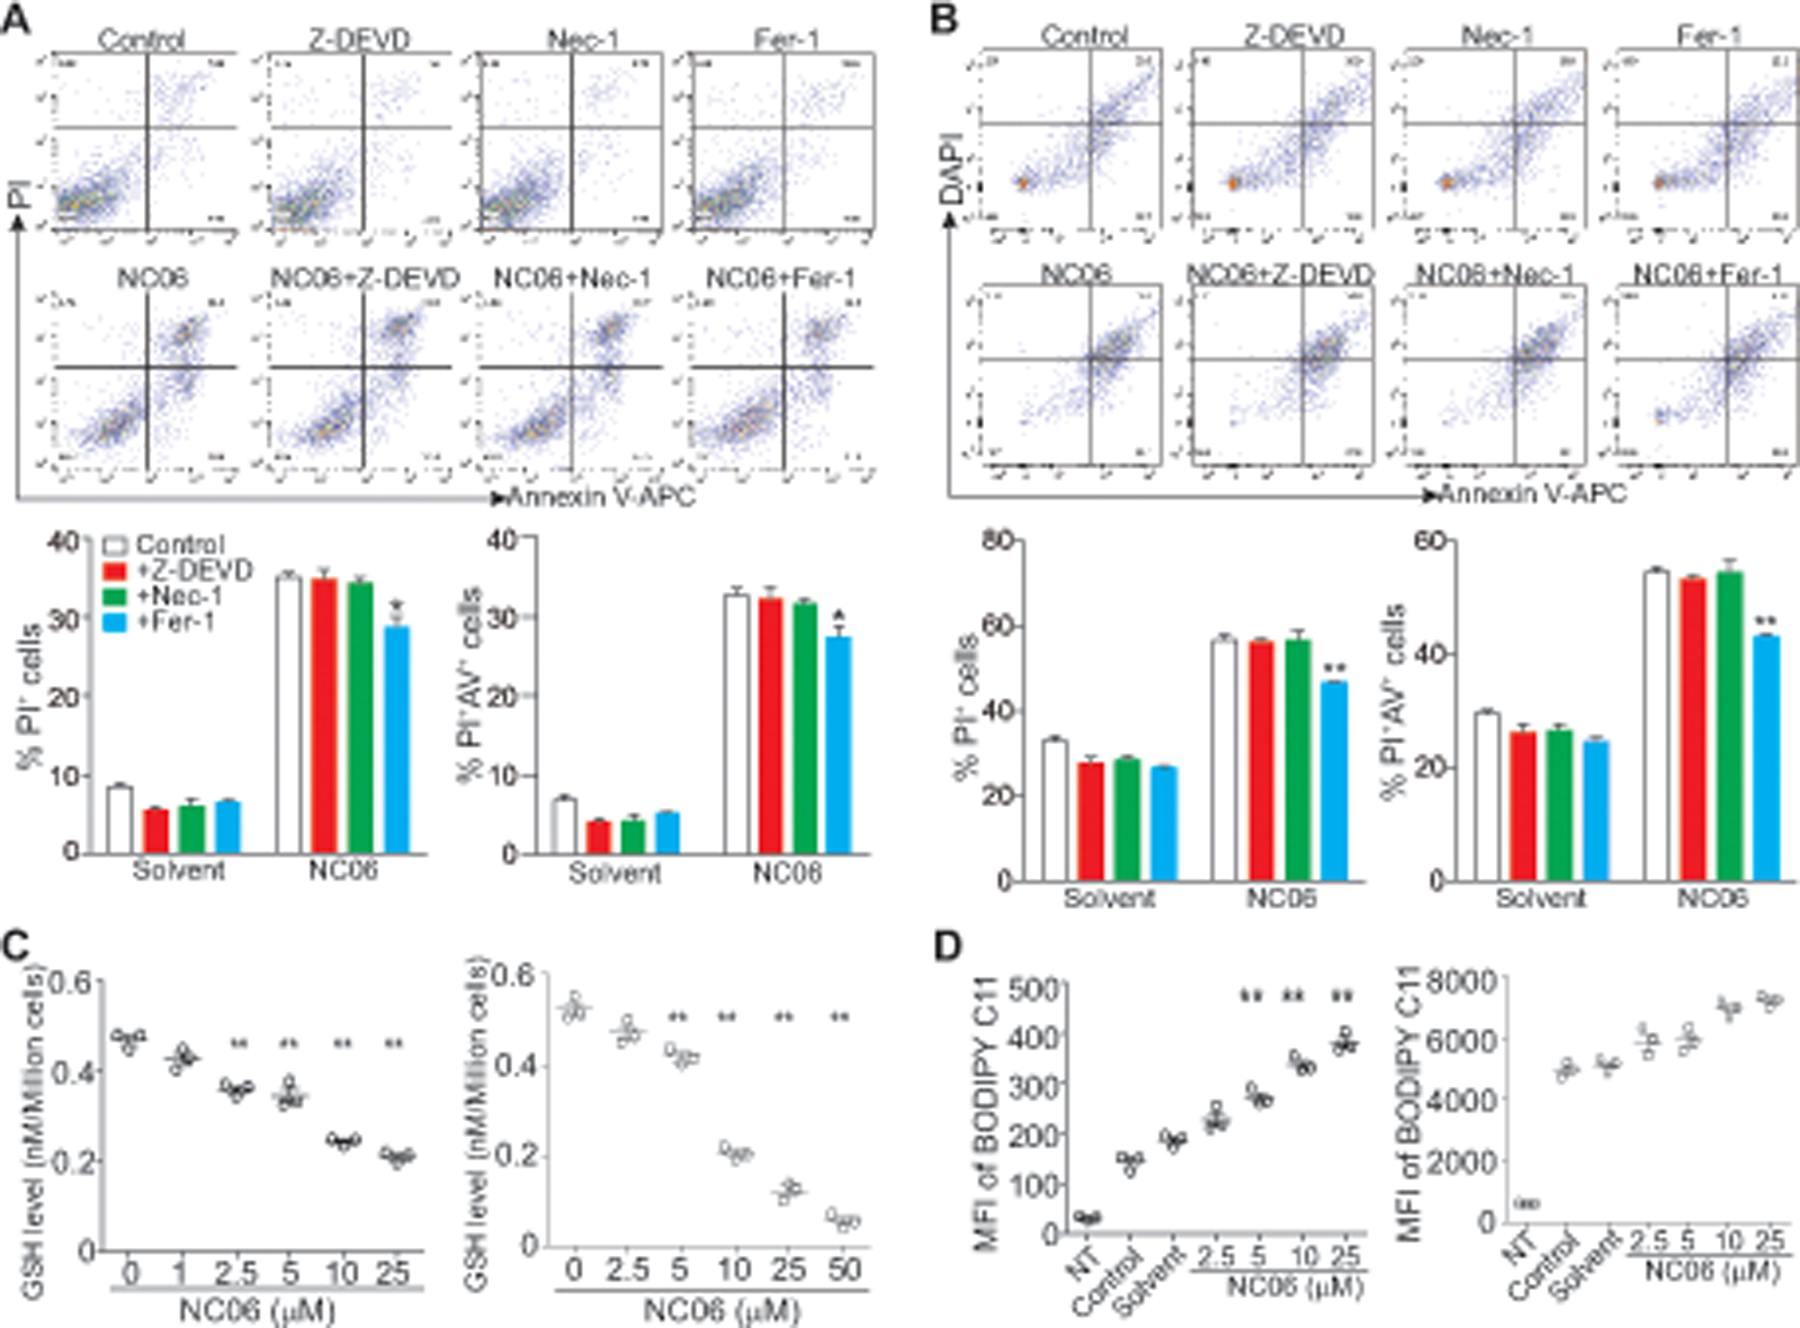
A. J774M cells were cultured in the presence of NC06 (25 μM) plus Z-DEVD (10 μM), Nec-1 (10 μM) and Fer-1 (10 μM) for 24h. Solvent, Z-DEVD, Nec-1, and Fer-1 alone were used as controls. Cells were stained with PI and Annexin V and analyzed by flow cytometry. Cell death was quantified and presented at the bottom panel. Column: mean, bar: SD. * p<0.05. Shown are representative results of one of three experiments. B. BM-MDSCs were treated as in A. Cells were stained with CD11b-, Gr1-specific antibodies and Annexin V, followed by staining with PI and analysis by flow cytometry. CD11b+Gr1+ cells were gated and analyzed for PI+ and Annexin V+ cells. Cell death was quantified and presented at the bottom panel. Column: mean, bar: SD. * p<0.05. C. J774M (left panel) and BM-MDSCs were treated with NC06 at the indicated concentrations for 24h. GSH levels were then determined using the GSH-Glo Glutathione Assay kit. ** p<0.01. D. J774M cells (left panel) and BM-MDSCs (right panel) were treated with NC06 as indicated for 24h. Cells were then incubated with BODIPY C11 for 30 min and analyzed by flow cytometry for quantifying lipid ROS level as measured by BODIPY C11 intensity. Shown is BODIPY C11 MFI.** p<0.01.