
Figure 7. Asah2 represses the p53 pathway in MDSCs.
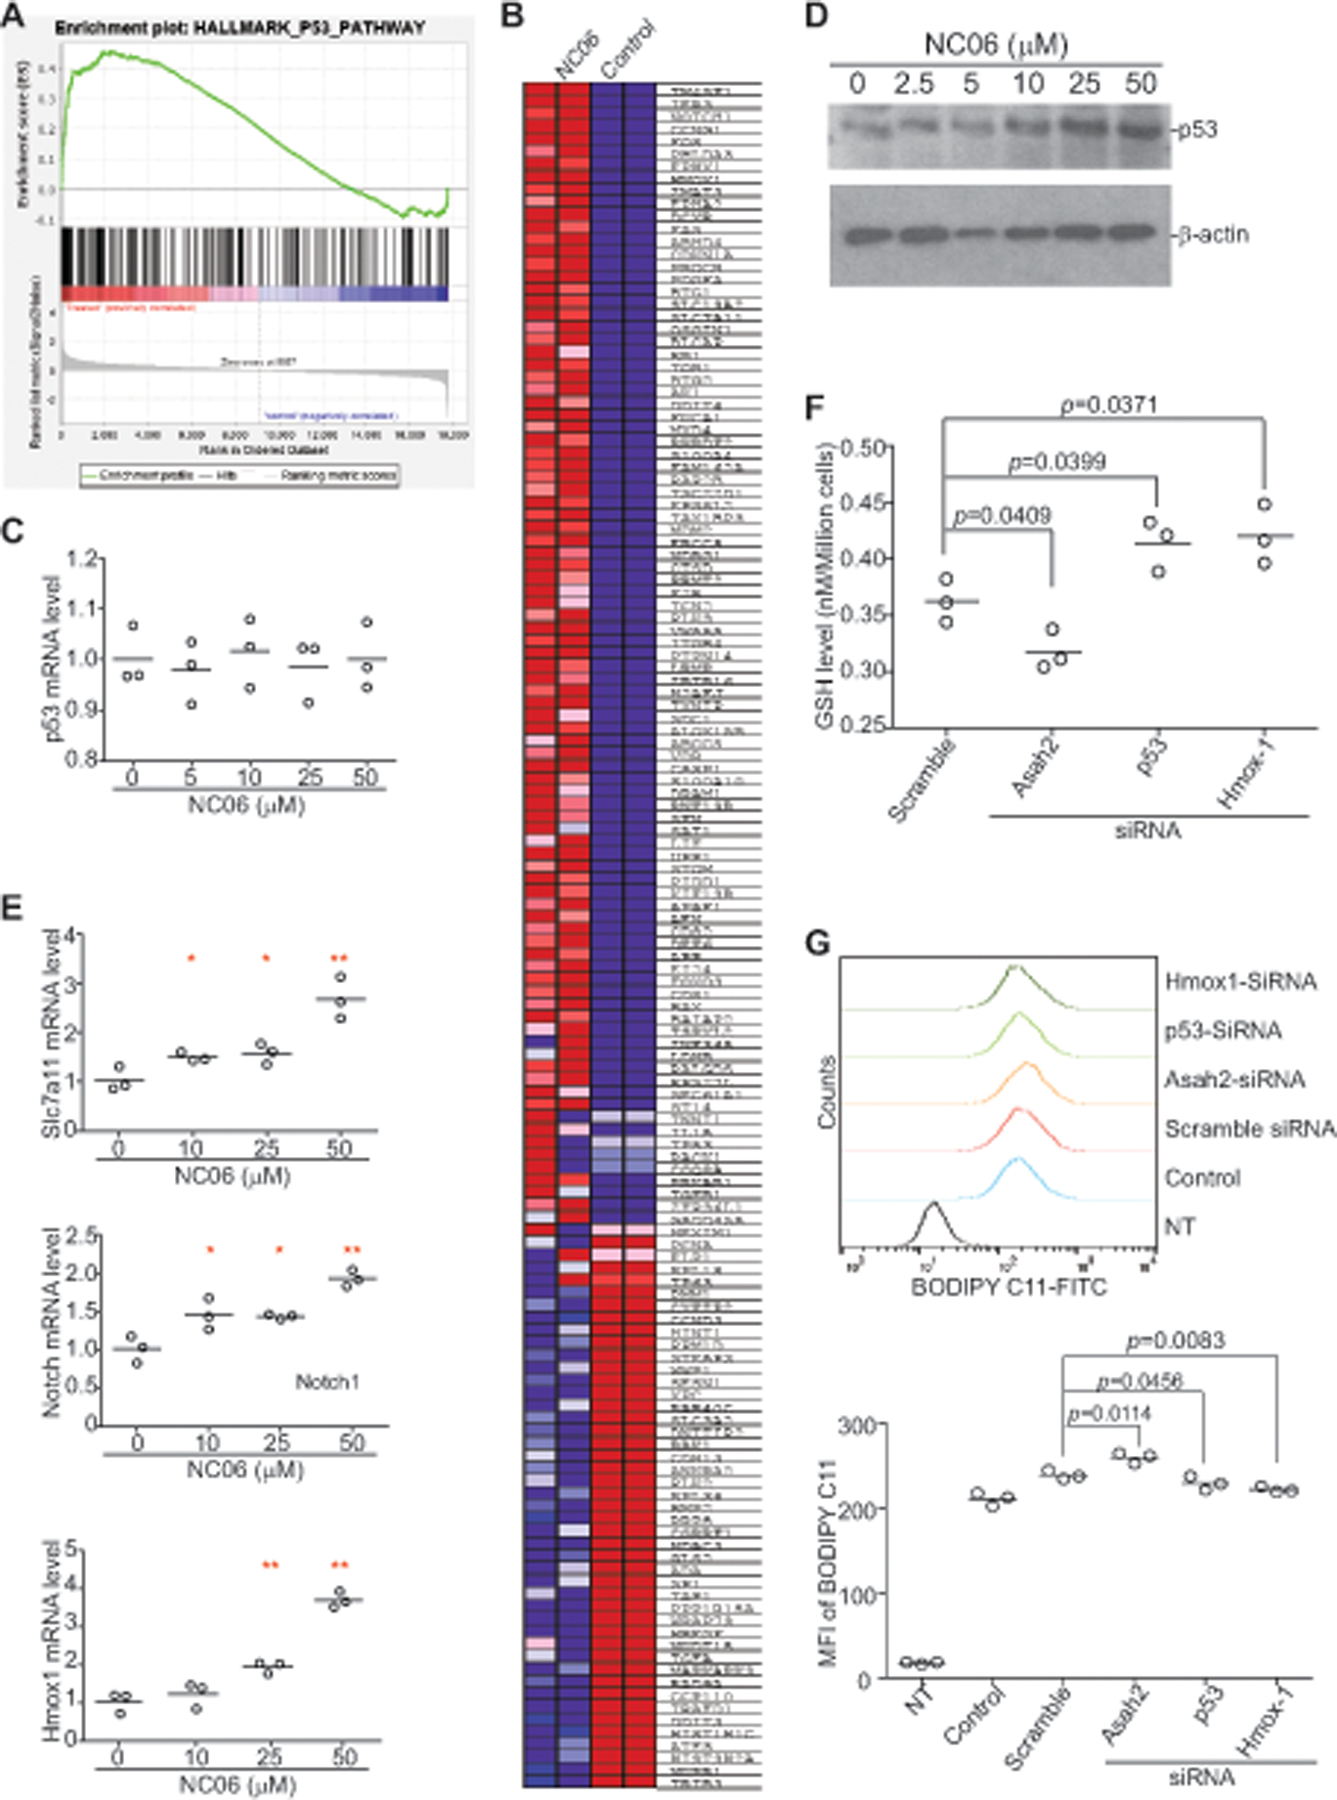
A. J774M cells were treated with NC06 (10 μM) for 24h and analyzed for genome-wide gene expression profiles by DNA microarray. Shown is the Gene Set Enrichment Analysis (GSEA) showing the enrichment plot of the p53 pathway. All GSEA false discovery rate q-values <0.0001. B. square graph showing the differentially expressed p53 pathway genes based on Gene Ontology (GO) terms. C. qPCR analysis of p53 expression in J774M cells after NC06 treatment for 24h at the indicated concentrations. D. Western blotting analysis of p53 protein in J774M cells treated with NC06 as indicated for 24h. The experiments were performed twice. E. J774M cells were treated with NC06 at the indicated concentrations for 24h and analyzed by qPCR using the indicated gene-specific primers. F. J774M cells were transfected with scramble and siRNAs that are specific for Asah2, p53 and Hmox1, respectively, for 24h. The cells were then measured for GSH level by flow cytometry. G. J774M cells were transfected with scramble and siRNAs that are specific for Asah2, p53 and Hmox1, respectively, for 24h. Cells were then analyzed for lipid ROS by flow cytometry. NT: No staining negative control cells for flow cytometry; control: no transfection.