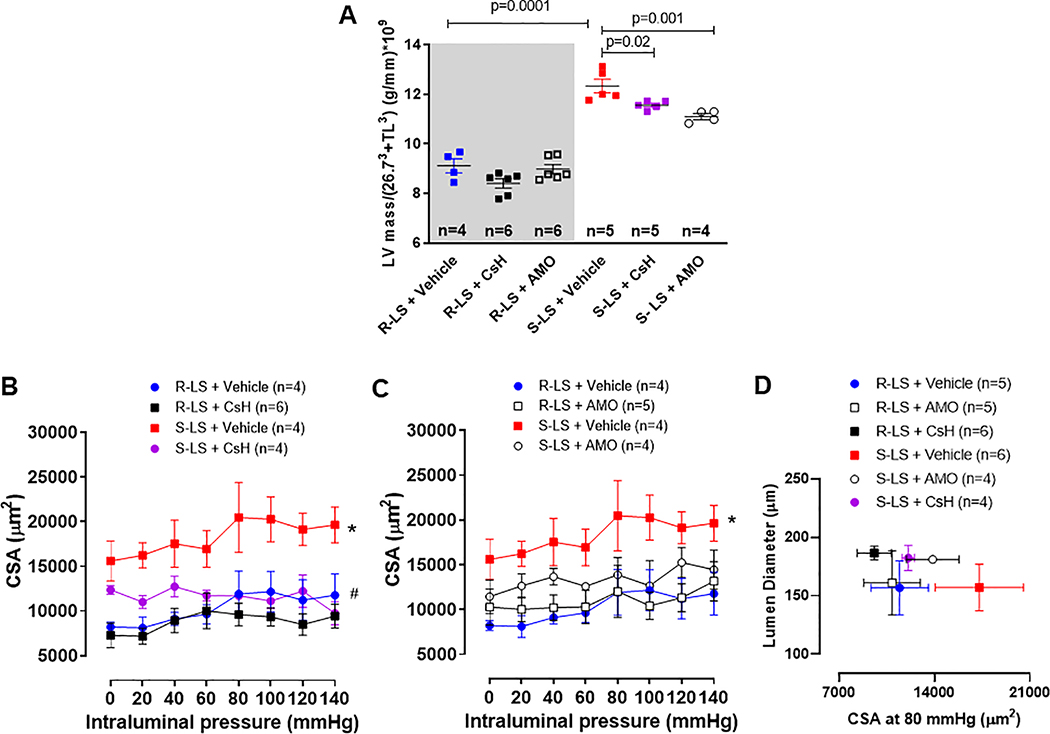
Figure 4.
Left ventricle (LV) mass normalized by tibia lenght (TL)3 (A). For this, the linear relation with LV and TL3 showed that LV weight crossed the x-axis at TL3 −26.73 (95% CI −29.83; −23.43). Therefore, TL and LV weight were indexed by dividing the weights by 26.73 + TL3. Cross-sectional area (CSA) measured with increasing intraluminal pressure in mesenteric resistance arteries from male Dahl salt resistant (R) and Dahl salt sensitive (S) rats on low salt (LS, 0.3%) treated with cyclosporin H (CsH) (B) or amoxicillin (AMO) (C) for 14 days. Mesenteric resistance arteries at 80 mmHg from all groups are plotted CSA vs. lumen diameter (D), suggesting vascular hyperthrophy. Data presented in mean ± SEM. Number of animals and p value are indicated on graphs, otherwise p value <0.05. Statistics: One or two- way ANOVA; * vs. R-LS; # vs. S-LS.

