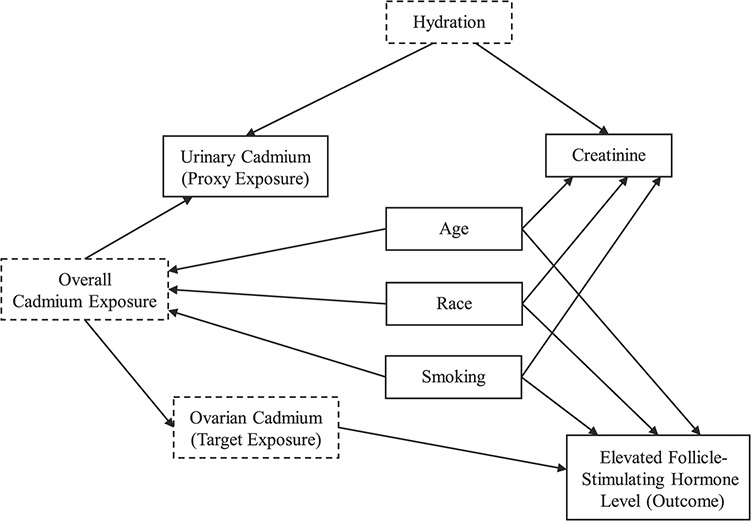
Figure 1.

Directed acyclic graph of the hypothesized causal pathway between urinary cadmium concentrations and elevated follicle-stimulating hormone concentrations, Third National Health and Nutrition Examination Survey, 1988–1994. Variables with solid lines were observed; those with dashed lines were unobserved. For simplicity, unilateral oophorectomy and hysterectomy, which were hypothesized to directly affect follicle-stimulating hormone levels, are not included in the figure.
