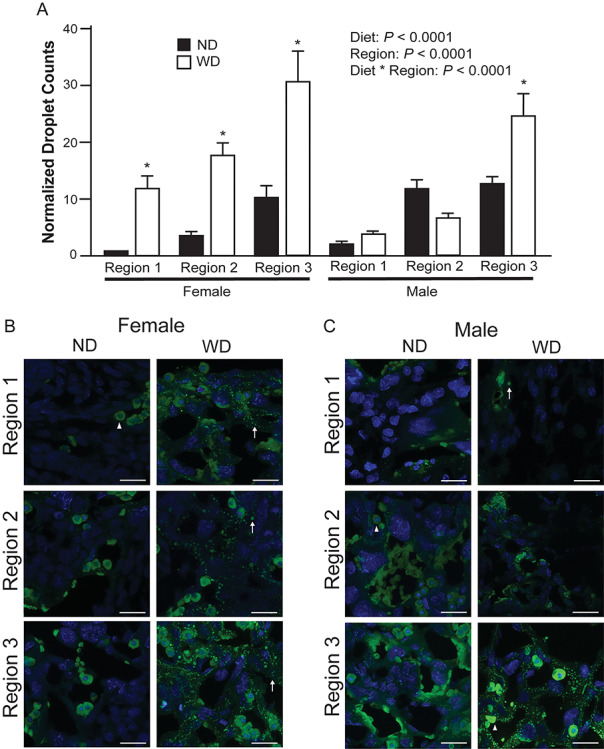
Figure 3.

Droplet counts of BODIPY-stained placenta (A) from ND (n = 3 placentas/sex, 3 sections/placenta) and WD (n = 3 placentas/sex, 3 sections/placenta). Region 1 correlates with decidua, region 2 correlates with junctional zone, and region 3 correlates with labyrinth. Representative images from female (B) and male (C) placentas. Normalized droplet counts are the average number of droplets in each experimental group per one droplet in ND female region 1. Triangle indicates putative steroidogenic cell, arrow indicates a lipid droplet. Scale bars = 22 μm. All data are mean ± SEM, * indicates P < 0.05 for pairwise comparison of ND and WD.
