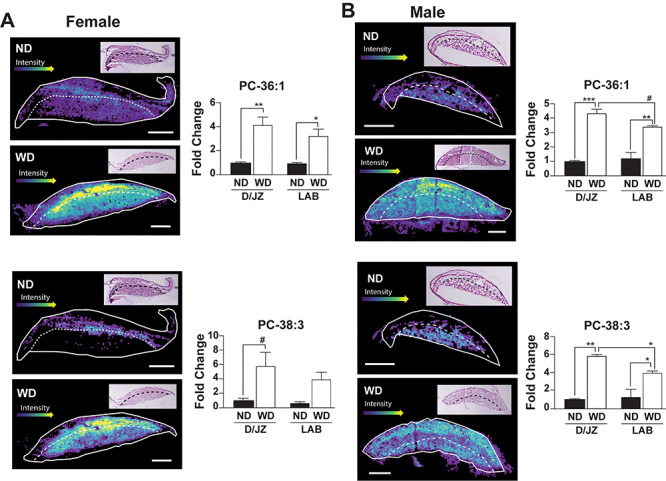
Figure 4.

Representative images and relative quantification of PC 36:1 and PC 38:3, respectively in the labyrinth (LAB) and decidua/junctional zone (D/JZ) of male and female placentas (n = 3/experimental group). LAB and D/JZ are denoted by broken line based on tissue section morphology. Scale bar = 1 mm. All data are mean ± SEM, ****P < 0.001, **P < 0.01, *P < 0.05, #P < 0.1.
