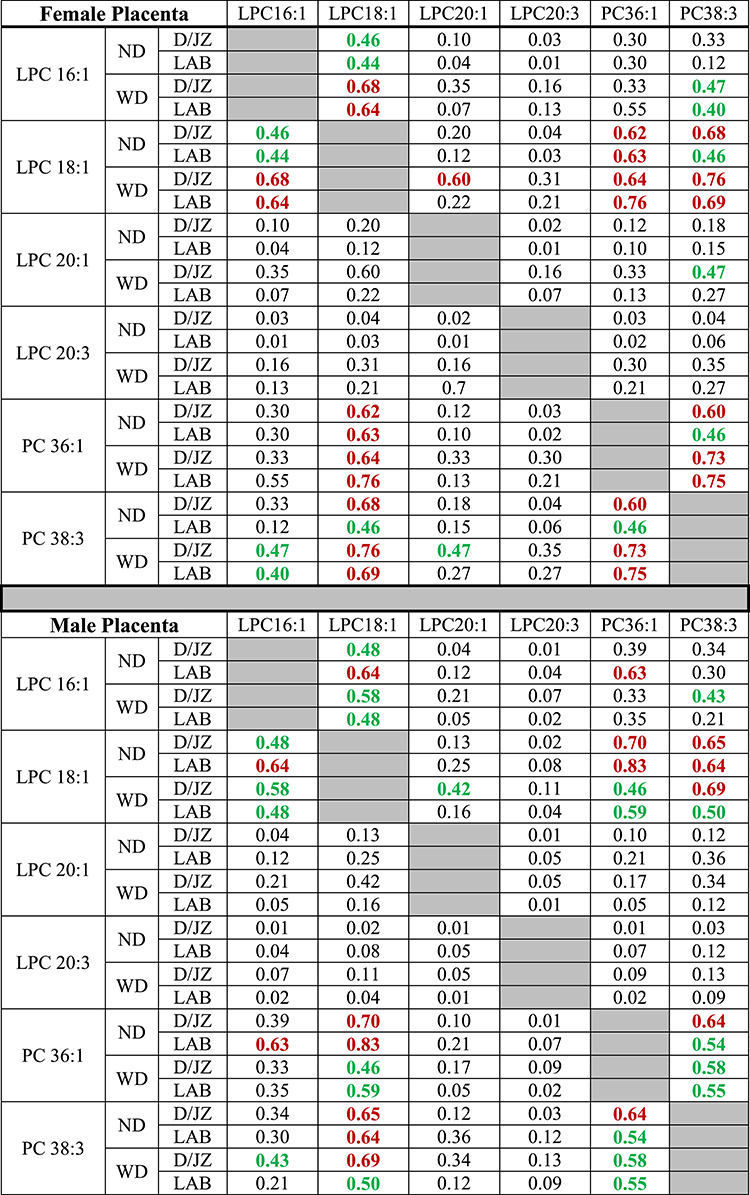
Table 1.
Correlation coefficients between LPCs and PCs

|
Red bolded numbers represent a strong correlation (r = 0.6–0.79) and green bolded numbers represent moderate correlation (r = 0.40–0.59), n = 3 per each experimental group per each comparison.
