Figure 3.
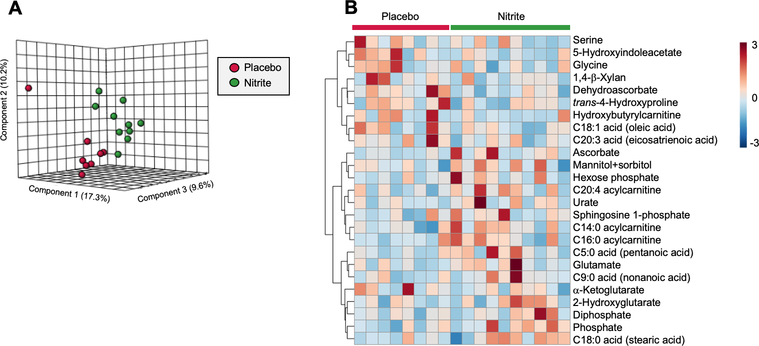
Targeted metabolomics analysis of plasma samples taken before and after chronic supplementation with sodium nitrite or placebo from a subset of subjects (N=8–10/group). 3-Dimensional partial least squares-discriminant analysis depicting the differential response to treatment (expressed as a fold change from baseline within each group) in the sodium nitrite and placebo-treated groups (A). Hierarchical clustering analysis of top 25 metabolites differentially altered by treatment between sodium nitrite and placebo-treated groups (each box represents a fold change from baseline for a given subject) (B).

