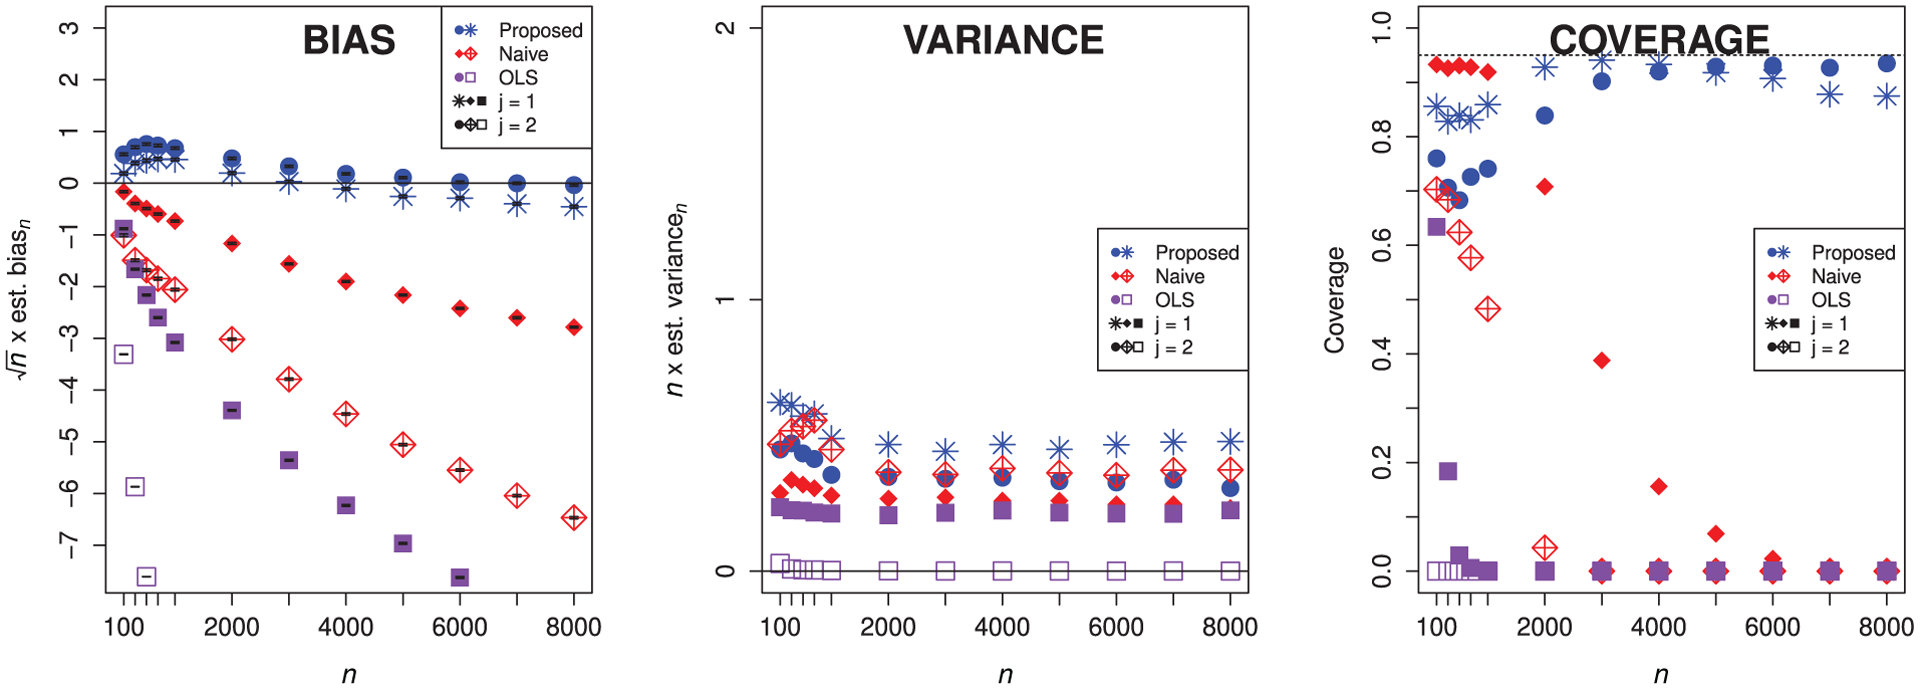
FIGURE 1.

Empirical bias (scaled by n1/2) with Monte Carlo error bars, empirical variance (scaled by n), and empirical coverage of nominal 95% confidence intervals for the proposed, naive, and OLS estimators for either feature, using loess smoothing with cross-validation tuning (in the case of the proposed and naive estimators). Circles, filled diamonds, and filled squares denote that we have removed X1; stars, crossed diamonds, and empty squares denote that we have removed X2.
