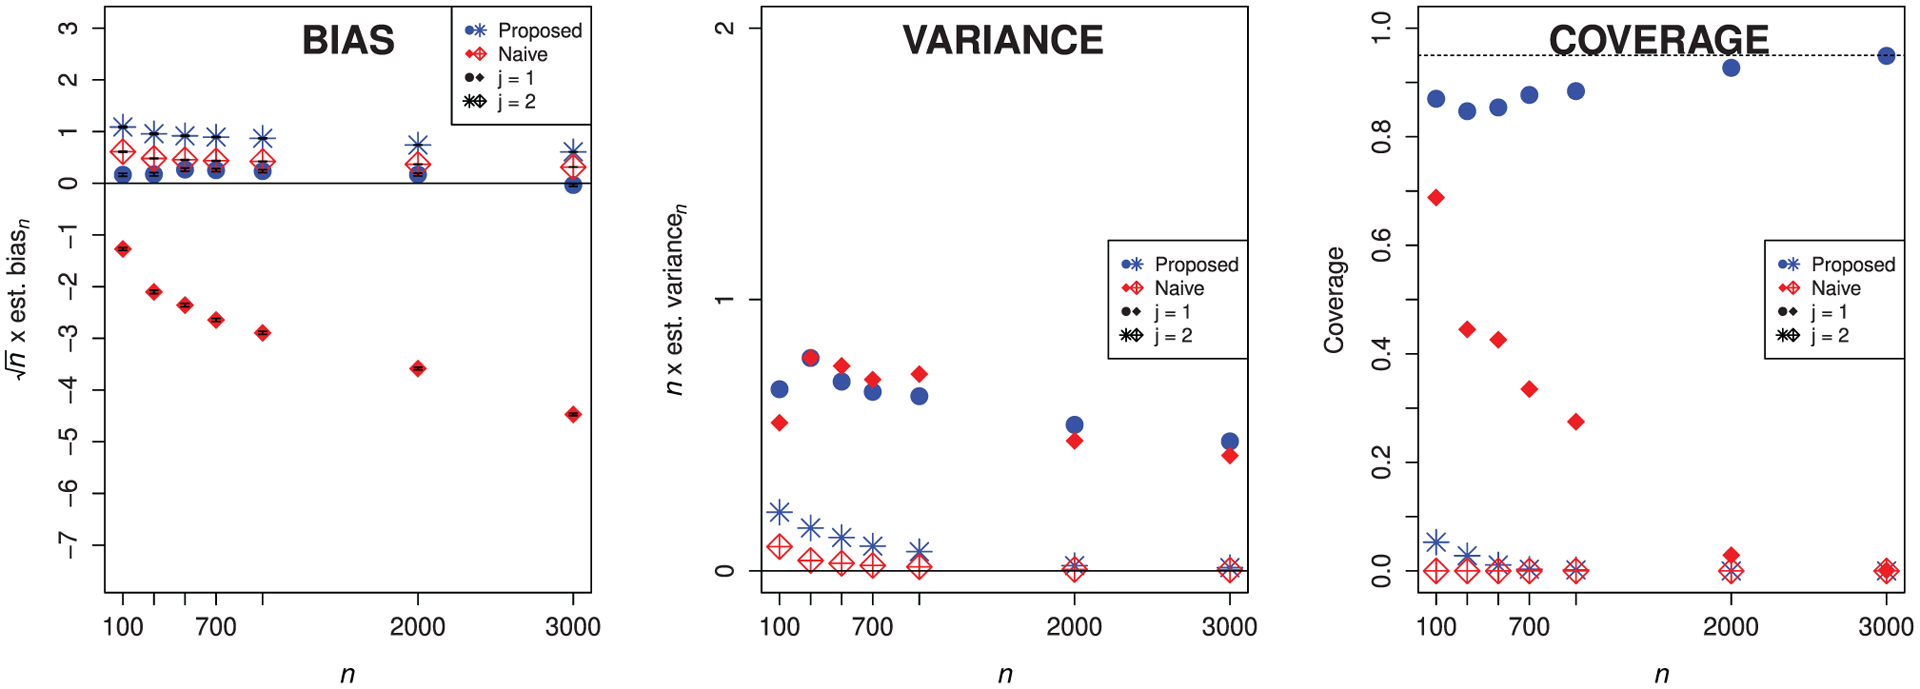
FIGURE 2.

Empirical bias (scaled by n1/2) with Monte Carlo error bars, empirical variance (scaled by n), and empirical coverage of nominal 95% confidence intervals for the proposed and naive estimators for either feature, using loess smoothing with cross-validation tuning. Circles and filled diamonds denote that we have removed X1, while stars and crossed diamonds denote that we have removed X2. We operate under the null hypothesis for X2, that is, ψ0,2 = 0.
