
FIGURE 4.
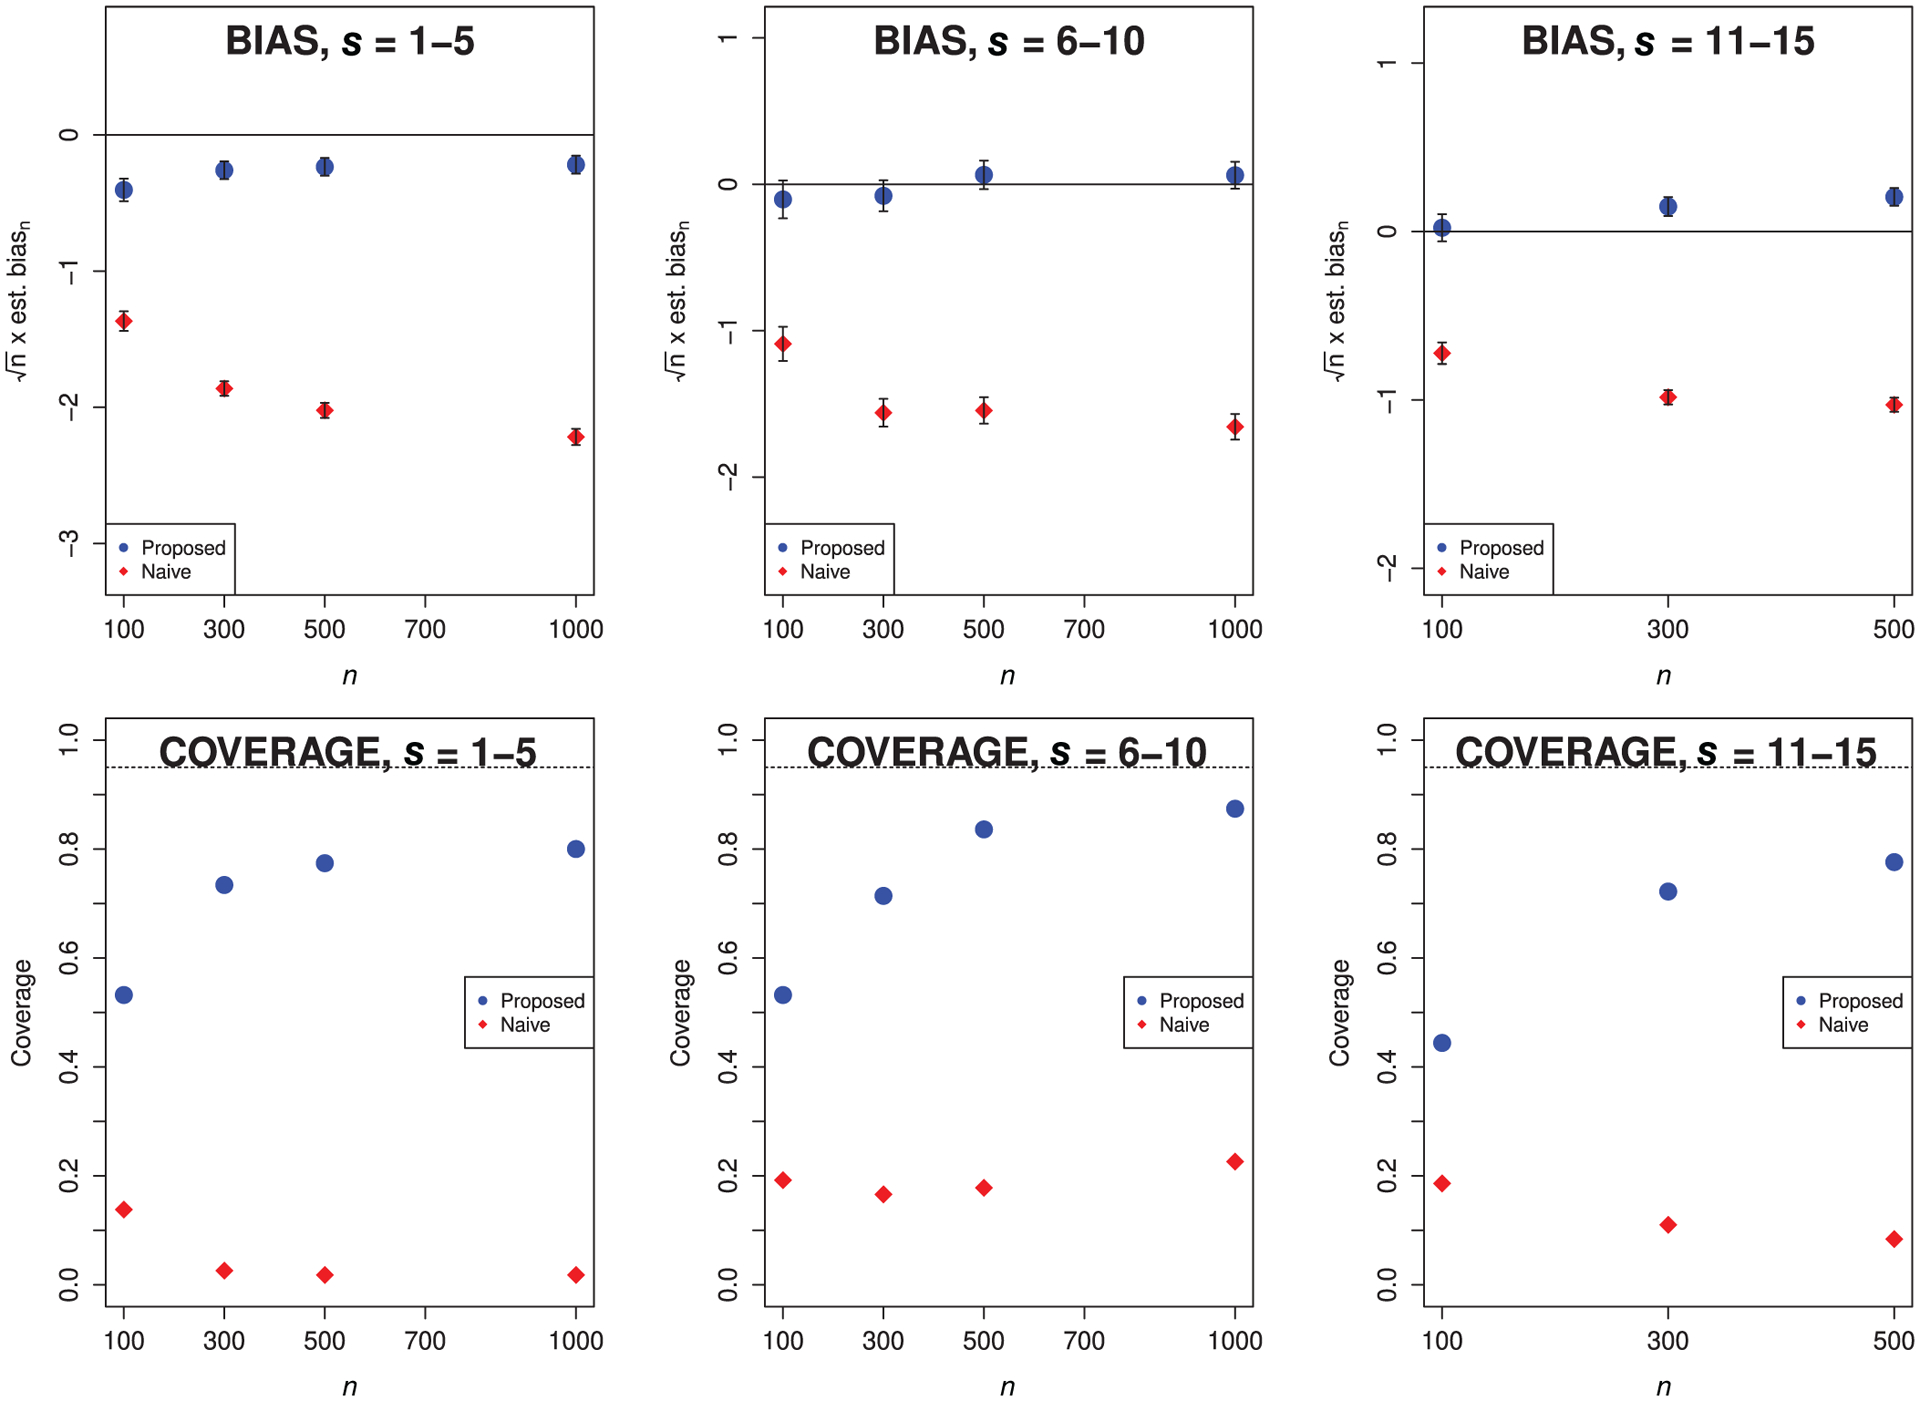
Top row: empirical bias for the proposed and naive estimators scaled by n1/2 for setting B, using gradient-boosted trees. Bottom row: empirical coverage of nominal 95% confidence intervals for the proposed and naive estimators for setting B, using gradient-boosted trees. We consider all s combinations from Table 1. Diamonds denote the naive estimator, and circles denote the proposed estimator. Monte Carlo error bars are displayed vertically.