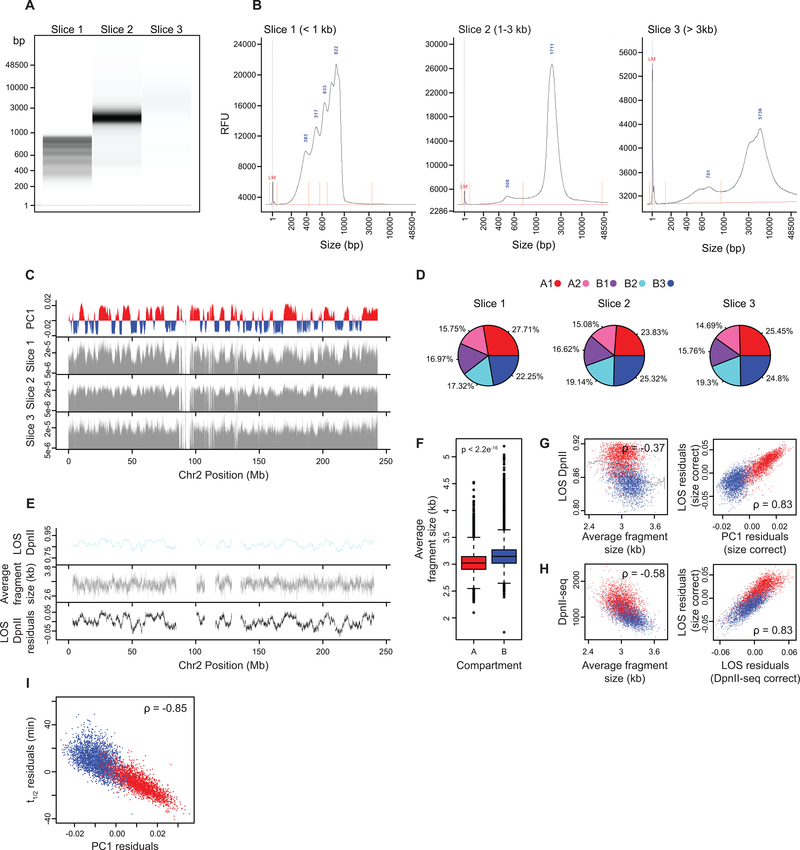
Extended Data Fig. 4: Average fragment size per bin and correlation with chromatin stability.
(A) DNA purified from nuclei pre-digested with DpnII for 4 hours were separated into slices of three sizes and run on a Fragment Analyzer. One experiment was performed.
(B) Fragment Analyzer distributions of DNA fragment sizes for the three separated slices (RFU: relative fluorescence unit, LM: lower marker, fragment sizes at distribution peaks are given in blue).
(C) Top plot: Eigenvector 1 values (PC1, 40 kb resolution) across a section of chromosome 2, representing A (red) and B (blue) compartments. Bottom three plots: Normalized coverage of fragments from given slice size across a section of chromosome 2.
(D) Percentages of fragments mapped to each subcompartment for given slice size.
(E) Top plot: LOS along chromosome 2 at 40 kb resolution for nuclei pre-digested with DpnII. Middle plot: Average fragment size estimated for every 40kb bin after pre-digestion with DpnII (Methods). Bottom plot: LOS-residuals for nuclei pre-digested with DpnII after correction for average fragment size.
(F) Boxplot of average fragment size for A compartment bins (n=35836) and B compartment bins (n=33252). Significance determined by two-sample two tailed t-test (p < 2.2e-16, t = −80.535, d.f. = 67270, 95% CI= −0.1228385,−0.1170014). Boxplot middle line is the median, the lower and upper edges of the box are the first and third quartiles, the whiskers extend to interquartile range (IQR) × 1.5 from the box. Outliers are represented as points.
(G) Left plot: correlation between LOS for nuclei pre-digested with DpnII and average fragment size. Grey line indicates moving average used for residual calculation. Right plot: partial correlation between residuals of LOS for nuclei pre-digested with DpnII and residuals of PC1 after correcting for correlations between LOS and average fragment size and PC1 and average fragment size (for chromosome 2, Spearman correlation values are indicated).
(H) Left plot: Correlation between DpnII-seq signal and average fragment size. Right plot: correlation between residuals of LOS after correcting for average fragment size and residuals of LOS after correcting for DpnII-seq signal (for chromosome 2, Spearman correlation values are indicated).
(I) Partial correlation between residuals of t1/2 and residuals of PC1 after correcting for correlations between t1/2 and average fragment size and PC1 and average fragment size.

