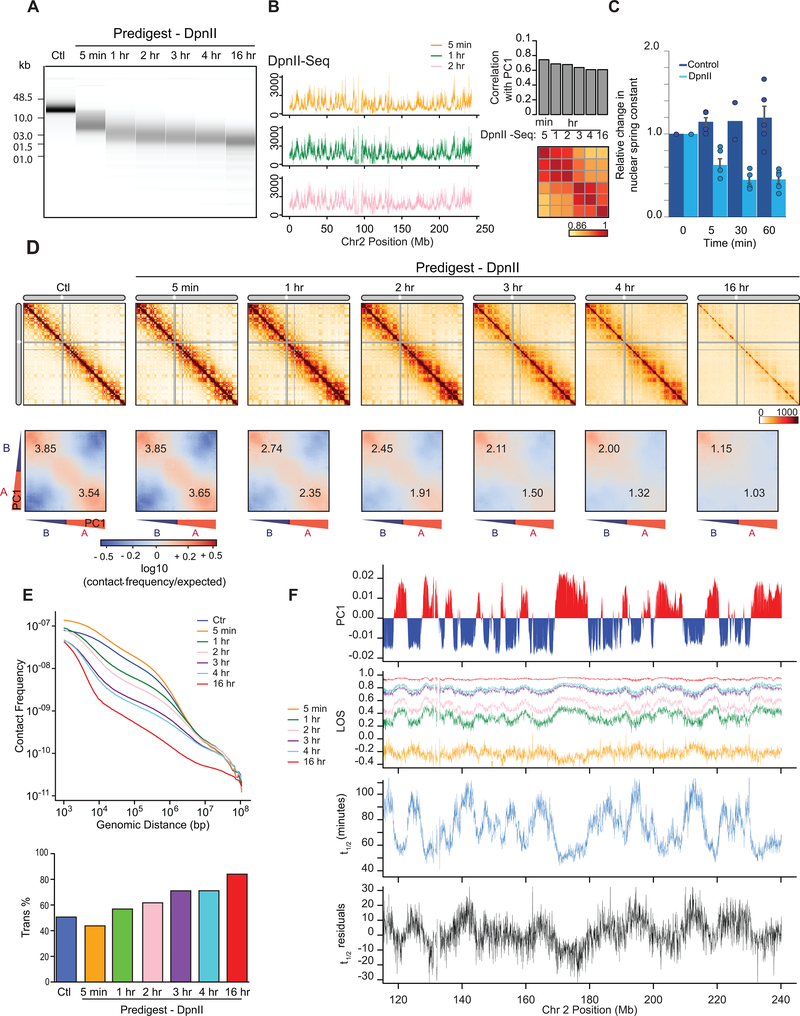
Fig. 4: Kinetics of chromatin fragmentation and chromatin dissolution.
(A) DNA purified from undigested nuclei, and nuclei pre-digested with DpnII for different time points were run on a Fragment Analyzer. Representative data are shown for 1 out of 2 replicates.
(B) Left: DpnII-seq signals along chromosome 2 binned at 40-kb resolution after digestion for 5 minutes, 1 hour and 2 hours. Right: correlation between DpnII-seq signals and PC1 and between DpnII-seq signals at different time points.
(C) Relative change in nuclear spring constant (nN/μm) after DpnII fragmentation at different time points. Spring constant is significantly decreased after 5 minutes and at background level by 1 hour (P = 0.002; two-tailed t-test; n = 4 or 5 nuclei except for control nuclei at t = 30 minutes where n = 2; each measured three times; error bars represent standard error of the mean). Bars show the average of all nuclei, dots indicate values obtained with individual nuclei.
(D) Top row: Hi-C interaction maps of chromosome 2 binned at 500 kb. Control: nuclei in restriction buffer for 4 hours. Pre-digest DpnII: nuclei were pre-digested with DpnII for 5 minutes up to 16 hours. (Extended Data Fig. 7A).
Bottom row: compartmentalization saddle plots for the corresponding conditions. Numbers indicate strength of A-A and B-B interactions for intra-chromosomal interactions.
(E) Top: genome-wide interaction frequency as function of genomic distance for Hi-C data shown in panel (D). Bottom: percentage of inter-chromosomal (trans) interactions genome-wide for control nuclei and for nuclei pre-digested with DpnII for up to 16 hours.
(F) Top: PC1 along a section of 120 Mb of chromosome 2. Second plot: LOS along chromosome 2 at 40-kb resolution for all time points (Extended Data Fig. 2B). Third plot: half-life (t1/2) values derived from the exponential fit of the six time-points for every 40-kb bin (Extended Data Fig. 7C). Bottom plot: residuals of t1/2 after correcting for correlations between t1/2 and DpnII-seq (DpnII-seq data for t = 1 hour).

