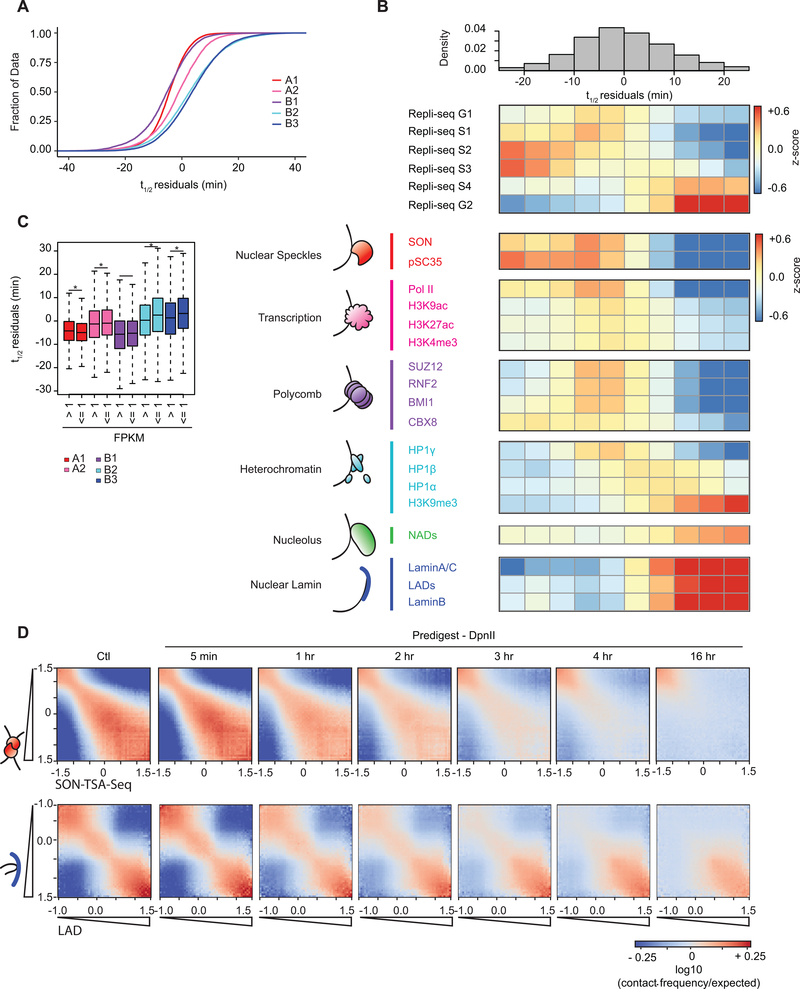
Fig. 5: Dissociation kinetics of chromatin interactions at different sub-nuclear structures.
(A) Cumulative distributions of residuals of t1/2 (in minutes) for each of the five annotated sub-compartments.
(B) Top: the genome was split into 10 bins, where each bin corresponds to sets of loci that share the same t1/2 residual interval. Middle: For each t1/2 residual interval a heatmap of mean z-score signal of Repli-Seq data in different phases of the cell cycle G1, S1–4, G2. Bottom: For each t1/2 residual interval a heatmap of mean z-score signal enrichment was quantified for various markers of sub-nuclear structures (See Methods).
(C) (C) Boxplot of t1/2 residuals for bins with expressed genes (mean FPKM > 1) in sub-compartments: A1 (n = 7,045), A2 (n = 4,154), B1 (n = 1,565), B2 (n = 805), and B3 (n = 1,030) and bins with low or no expression (mean FPKM ≤1) in sub-compartments A1 (n = 3,486), A2 (n = 2,800), B1 (n = 4,726), B2 (n = 5,803), and B3 (n = 8,717). Significant difference in t1/2 residuals between expressed and non-expressed bins per subcompartment determined by two-sample two tailed t-test (A1: P = 1.04 × 10⁻⁸, t = 5.731, d.f. = 6,885.4, 95% CI = 0.57, 1.17; A2: P = 0.002, t = −3.090, d.f. = 6,072.8, 95% CI = −1.12, −0.25; B1: P = 0.493, t = −0.685, d.f. = 2,528.7, 95% CI = −0.73, 0.35; B2: P = 6.05 × 10⁻⁸, t = −5.457, d.f. = 1,051.8, 95% CI = −3.02, −1.42; B3: P = 3.29 × 10⁻¹⁰, t = −6.335, d.f. = 1,270.2, 95% CI = −2.84, −1.50). An asterisk denotes P < 0.003. Boxplot middle line is the median, the lower and upper edges of the box are the first and third quartiles, the whiskers extend to interquartile range (IQR) × 1.5 from the box.
(D) Homotypic interaction saddle plots for loci ranked by their association with speckles (as detected by SON-TSA-seq, top 3) and by their association with the nuclear lamina. Preferential pair-wise interactions between loci associated with the lamina can still be observed after several hours, whereas preferential pair-wise interactions between loci associated with speckles are lost more quickly.

