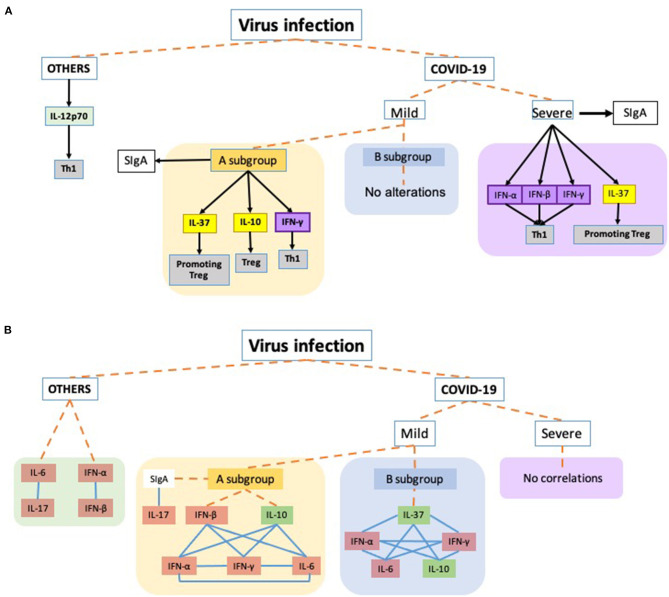
Figure 3.
Schematic representation of the main findings of this study. Dashed orange lines virus infection to each virus groups: OTHERS (other respiratory viruses, not SARS-Cov2), COVID-19 severity (Mild: mild symptoms and Severe: acute respiratory distress syndrome) and the respective subgroups. COVID-19 Mild A subgroup was composed of patients presenting SIgA levels above the threshold and the Mild B subgroup was composed of mild COVID-19 group presenting SIgA levels below the threshold. (A) Black arrows toward the boxes mean that the cytokines were released by the group/subgroup. The black arrow connecting the severe subgroup to SIgA indicates a higher increase in the antibody levels than observed in the Mild A subgroup which also presented increased levels. Yellow boxes are representing anti-inflammatory cytokines involved in the T regulatory response (Treg), while the purple boxes are representing the interferons, and the gray boxes indicate the t cell profile involved in the corresponding cytokine. (B) Representation of correlations observed in the study. Blue lines connecting the boxes mean that the parameters presented significant positive correlations between them. Orange boxes representing the pro-inflammatory cytokines and the green boxes corresponding to anti-inflammatory cytokines.

