Figure 3.
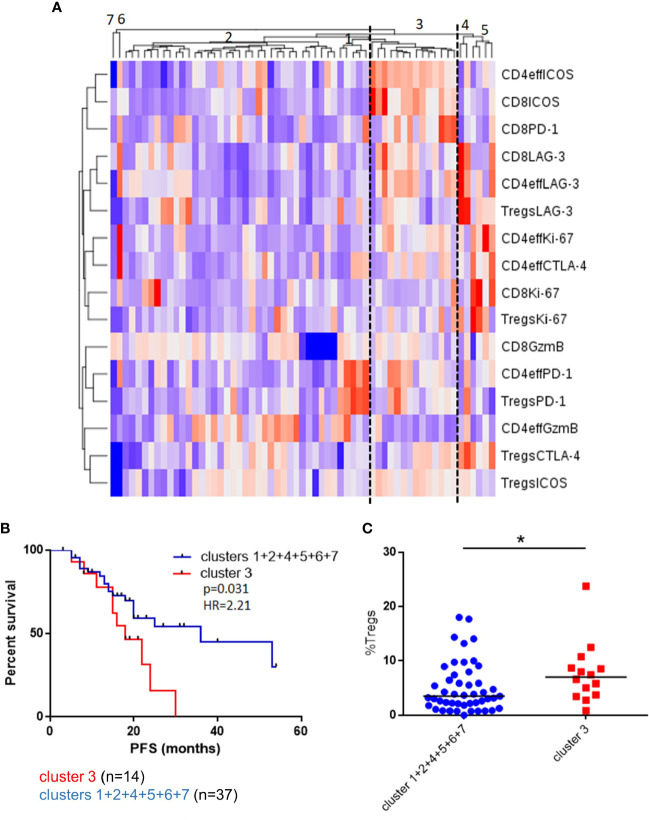
Unsupervised clustering of BM T cell phenotype defines a patient subset with a distinct phenotype and poorer outcomes. (A) Unsupervised hierarchical clustering and heatmap of activation and inhibitory receptors on CD4eff, CD8, and Treg cells in 61 patients 3 months post-ASCT. (B) PFS in patients in cluster 3 and clusters 1 + 2+4+5+6+7+8. (C) Frequency of Tregs in patients in cluster 3 and other clusters. Statistical analysis by using Mann-Whitney U test *p < 0.05.

