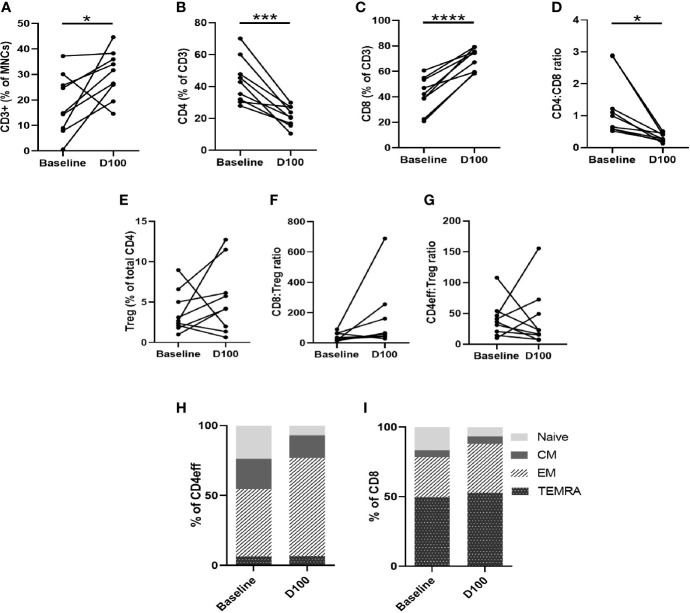
Figure 4.
Characterization of T cell subsets by flow cytometry of paired BM samples at diagnosis and D100 post-ASCT. (A) Change in frequency of total CD3, (B) CD4, (C) CD8, (D) CD4:CD8 ratio, (E) Tregs, (F) CD8:Treg ratio (G) CD4:Treg ratio. Ratios calculated using absolute numbers of populations in each sample. (H) Changes in CD4eff memory subtypes as defined by CCR7 and CD45RA expression, (I) CD8 memory subtypes. Statistical analysis by paired Student’s t-tests *p < 0.05, ***p < 0.001, ****p < 0.0001.

