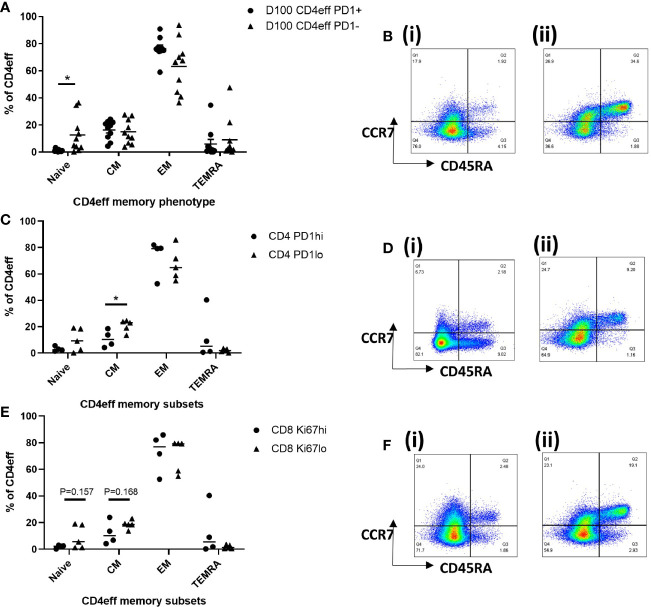
Figure 5.
Characterization of T cell memory subsets by flow cytometry at D100. (A) Graph of memory phenotypes of CD4eff PD-1+ vs CD4eff PD-1- populations. (B) Flow plots of a single sample showing memory phenotype of (i) CD4eff PD-1+ and (ii) CD4eff PD-1-. (C) CD4 memory phenotype of patients with high (frequency that is above median, n=4) or low (frequency that is equal to and below median, n=5) frequency of CD4eff PD-1+. (D) Flow plots showing memory phenotype of CD4eff from representative patients with (i) high and (ii) low frequency of CD4eff PD-1+ cells. (E) CD4 memory phenotype of patients with high or low frequency of CD8 Ki-67+ cells; (F) Flow plots showing CD4eff memory phenotype from representative patients with (i) high and (ii) low frequency of CD8 Ki-67+. Median indicated. Statistical analysis by Student t-test *p < 0.05, paired analysis in (A).

